How to Create Colorplot of 2D Array Matplotlib
-
Plot 2D Array in Matplotlib Using the
matplotlib.pyplot.imshow()Method -
Plot 2D Array in Matplotlib Using the
matplotlib.pyplot.pcolormesh()Method

This tutorial explains how we can generate colorplot plot of 2D arrays using the matplotlib.pyplot.imshow() and matplotlib.pyplot.pcolormesh() methods in Python.
Plot 2D Array in Matplotlib Using the matplotlib.pyplot.imshow() Method
The matplotlib.pyplot.imshow() method takes a 2D array as input and renders the given array as a raster image.
Syntax of matplotlib.pyplot.imshow()
matplotlib.pyplot.imshow(X,
                         cmap=None,
                         norm=None,
                         aspect=None,
                         interpolation=None,
                         alpha=None,
                         vmin=None,
                         vmax=None,
                         origin=None,
                         extent=None, *,
                         filternorm=True,
                         filterrad=4.0,
                         resample=None,
                         url=None,
                         data=None,
                         **kwargs)
matplotlib.pyplot.imshow() Example
import numpy as np
import matplotlib.pyplot as plt

X = np.random.randint(256, size=(10, 10))

fig = plt.figure(figsize=(8, 6))
plt.imshow(X)
plt.title("Plot 2D array")
plt.show()
Output:
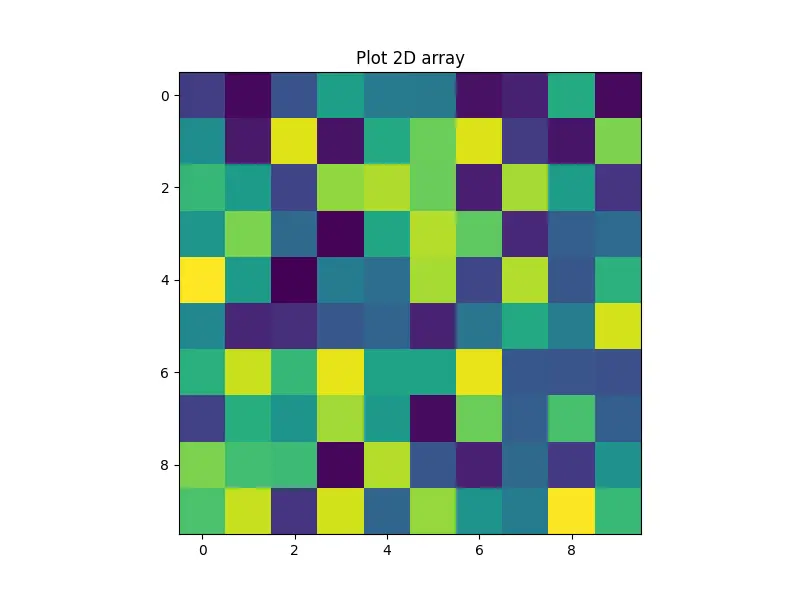
It plots the 2D array created using the numpy.random.randint() of size 10*10. By default, the values are mapped using the viridis colormap.
We can set the cmap parameter in the imshow() method to change the colormap.
import numpy as np
import matplotlib.pyplot as plt

X = np.random.randint(256, size=(10, 10))

fig = plt.figure(figsize=(8, 6))
plt.imshow(X, cmap="inferno")
plt.title("Plot 2D array")
plt.colorbar()
plt.show()
Output:

It displays the 2D array plot with the inferno colormap. We can also see a color bar at the right side of the plot, which tells us which values in the array are mapped to which colors.
Plot 2D Array in Matplotlib Using the matplotlib.pyplot.pcolormesh() Method
The matplotlib.pyplot.pcolormesh() function creates a pseudocolor plot in Matplotlib. It is similar to the matplotlib.pyplot.pcolor() function.
import numpy as np
import matplotlib.pyplot as plt

X = np.random.randint(256, size=(10, 10))

fig = plt.figure(figsize=(8, 6))
plt.pcolormesh(X, cmap="plasma")
plt.title("Plot 2D array")
plt.colorbar()
plt.show()
Output:

It plots the 2D array created using the numpy.random.randint() of size 10*10 with plasma colormap. The color bar at the right represents the colors assigned to different ranges of values.

Suraj Joshi is a backend software engineer at Matrice.ai.
LinkedIn