How to Annotate in Matplotlib
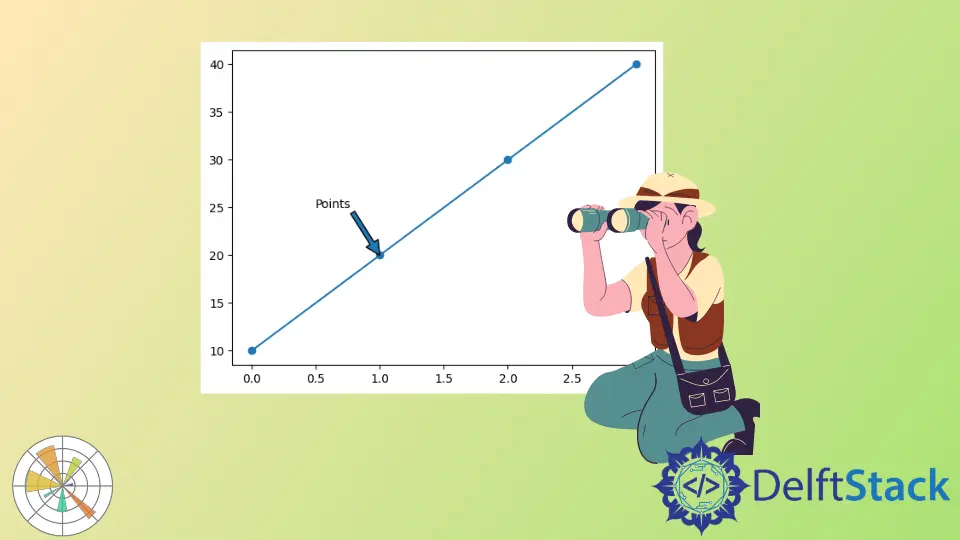
In this tutorial, we’ll look at how to add an annotation to the plot using the annotate() method with Matplotlib in Python.
Use the annotate() Method to Add Annotation to the Plot in Matplotlib
The plot annotation adds the note to the diagram or text to explain that point in the diagram or text. We can do the same way to add an annotation to the plot using the annotate() method.
There is another method of Matplotlib called text(). It also allows us to add the annotation to the plot but compared to the annotate() method, the text() method has very basic features.
The syntax of the annotate() method.
annotate(s, xy, *args, **kwargs)
| Parameters | Description |
|---|---|
s |
The first parameter is a text you want to add to the plot. |
xy |
The next is the xy parameter coordinates that accept a tuple and will take the float value. You need to mention the x coordinate and y coordinate, and this is the point where you want to annotate the points. |
*args,**kwargs |
These keyword arguments help us to change the text properties like font style, font size, etc. |
xytext |
The xytext parameter will give you the position where you want to annotate, so this is the optional parameter. If you do not mention this, it will take the second xy parameter as the position for the text. |
xycoords, textcoords |
We can use xycoords and textcoords, which take the coordinate system for XY and text. We can change the coordinate system of XY using this parameter.By default, this annotate() method will take the coordinate system as "data". If we want to change the coordinate system of the textcoords parameter, then we can change this parameter. |
arrowprops |
Add an arrow between the text and the point that is the annotated point or position. This argument takes the dictionary as a value, so we need to pass it key-value pair. It is optional if you do not mention that it will not add any arrow over the plot. This dictionary argument has several keys so read the detailed documentation from here. |
annotation_clip |
The annotation_clip is also an optional parameter. It will take the Boolean value, and this will tell when the annotation point xy is outside the axis area whether you want to draw the annotation.If you pass it "True" it will not draw when the xy point is outside the plot. If it is "False", it will draw. |
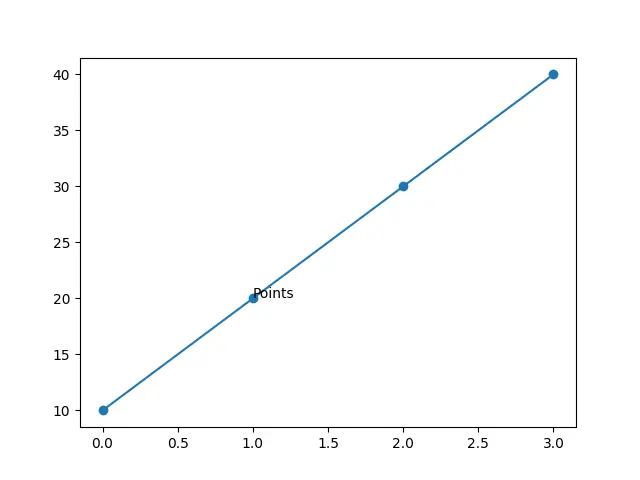
Code:
import matplotlib.pyplot as plot

plot.plot([10, 20, 30, 40], marker="o")

plot.annotate("Points", (1, 20))
plot.show()
Output:
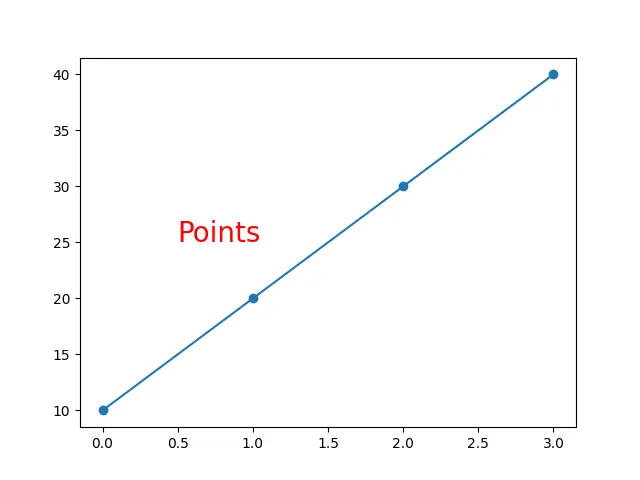
This next example is with the xytext and *args argument.
Code:
import matplotlib.pyplot as plot

plot.plot([10, 20, 30, 40], marker="o")

plot.annotate("Points", (1, 20), (0.5, 25), size=20, color="red")
plot.show()
Output:
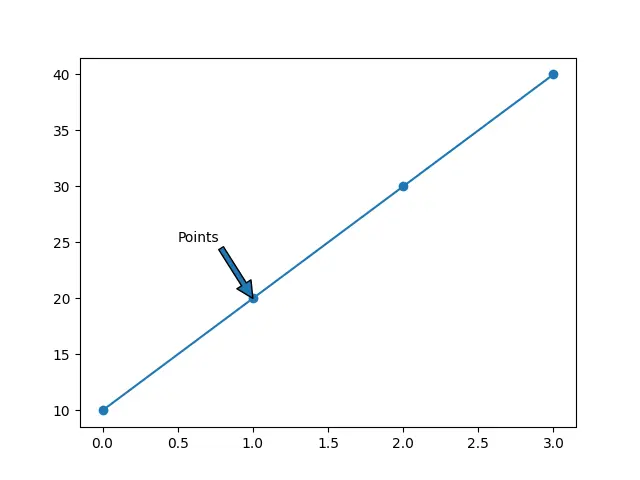
We can add an arrow using the arrowprops property of the annotate() method.
Code:
import matplotlib.pyplot as plot

plot.plot([10, 20, 30, 40], marker="o")

plot.annotate("Points", (1, 20), (0.5, 25), arrowprops={})
plot.show()
Output:
We can change the style of the arrow using the arrowstyle key.
Code:
import matplotlib.pyplot as plot

plot.plot([10, 20, 30, 40], marker="o")

plot.annotate("Points", (1, 20), (0.5, 25), arrowprops={"arrowstyle": "<->"})
plot.show()
Output:
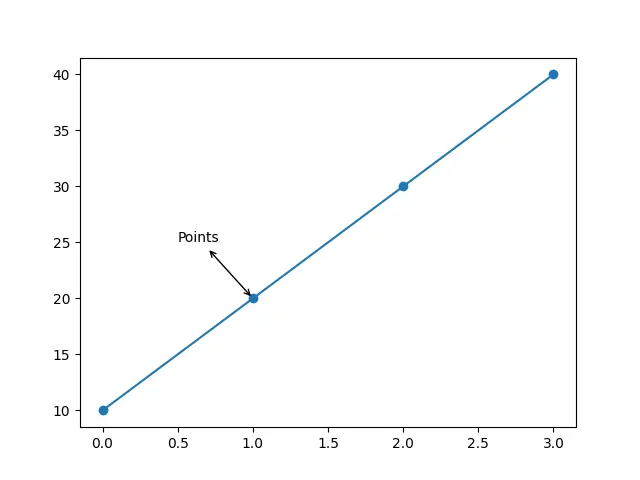
We can also use the width key to increase the arrow’s width, but we can not use the width and arrowstyle keys together. If we do this, then we will get an error.
We can only use this key when we do not use the key as arrowstyle.
Code:
import matplotlib.pyplot as plot

plot.plot([10, 20, 30, 40], marker="o")

plot.annotate("Points", (1, 20), (0.5, 25), arrowprops={"width": 10})
plot.show()
Output:
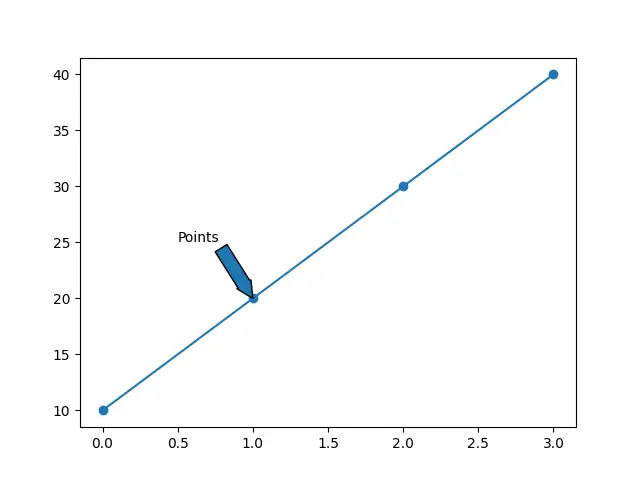
We can hide the annotation using the annotation_clip property when the coordinates of the annotation are outside of axes, so we will need to pass it the Boolean value as "True", but we want to see the annotation even the annotation coordinates are placed at outside the plot, so we pass it "False".
Code:
import matplotlib.pyplot as plot

plot.plot([10, 20, 30, 40], marker="o")

plot.annotate(
    "Points",
    (1, 20),
    (0.5, 45),
    arrowprops={"arrowstyle": "<->"},
    annotation_clip=False,
)
plot.show()
Output:
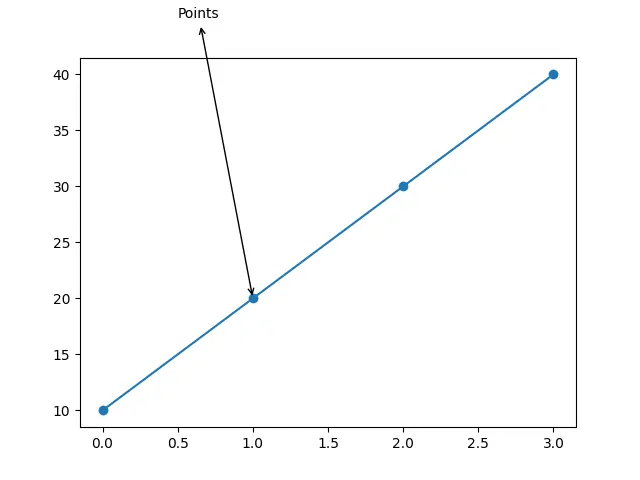
Hello! I am Salman Bin Mehmood(Baum), a software developer and I help organizations, address complex problems. My expertise lies within back-end, data science and machine learning. I am a lifelong learner, currently working on metaverse, and enrolled in a course building an AI application with python. I love solving problems and developing bug-free software for people. I write content related to python and hot Technologies.
LinkedIn