Matplotlib 注释
在本教程中,我们将了解如何在 Python 中使用带有 Matplotlib 的 annotate() 方法向绘图添加注释。
在 Matplotlib 中使用 annotate() 方法的绘图中添加注释
绘图注释将注释添加到图表或文本中,以解释图表或文本中的该点。我们可以使用 annotate() 方法为绘图添加注释。
Matplotlib 的另一种方法称为 text()。它还允许我们在绘图中添加注释,但与 annotate() 方法相比,text() 方法具有非常基本的功能。
annotate() 方法的语法。
annotate(s, xy, *args, **kwargs)
| 参数 | 描述 |
|---|---|
s |
第一个参数是要添加到绘图中的文本。 |
xy |
接下来是接受元组并将采用浮点值的 xy 参数坐标。你需要提及 x 坐标和 y 坐标,这是你要注释点的点。 |
*args,**kwargs |
这些关键字参数帮助我们更改文本属性,如字体样式、字体大小等。 |
xytext |
xytext 参数将为你提供要注释的位置,因此这是可选参数。如果你不提及这一点,它将采用第二个 xy 参数作为文本的位置。 |
xycoords, textcoords |
我们可以使用 xycoords 和 textcoords,它们采用 XY 和文本的坐标系。我们可以通过这个参数来改变 XY 的坐标系。默认情况下,这个 annotate() 方法会将坐标系作为"data"。如果我们想改变 textcoords 参数的坐标系,那么我们可以改变这个参数。 |
arrowprops |
在文本和作为注释点或位置的点之间添加一个箭头。此参数将字典作为值,因此我们需要将其传递给键值对。 如果你不提及它不会在绘图上添加任何箭头,则它是可选的。此字典参数有几个键,因此请从此处阅读详细文档。 |
annotation_clip |
annotation_clip 也是一个可选参数。它将采用布尔值,当注释点 xy 在轴区域之外时,它将告诉你是否要绘制注释。如果你传递它 "True",当 xy 点在绘图之外。如果它是"False",它将绘制。 |
代码:
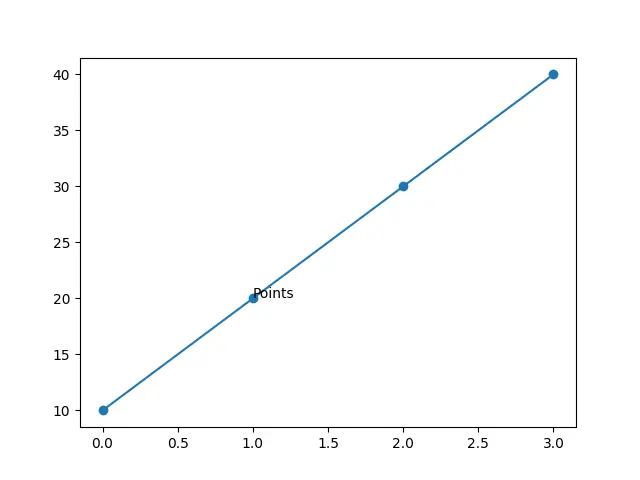
import matplotlib.pyplot as plot

plot.plot([10, 20, 30, 40], marker="o")

plot.annotate("Points", (1, 20))
plot.show()
输出:
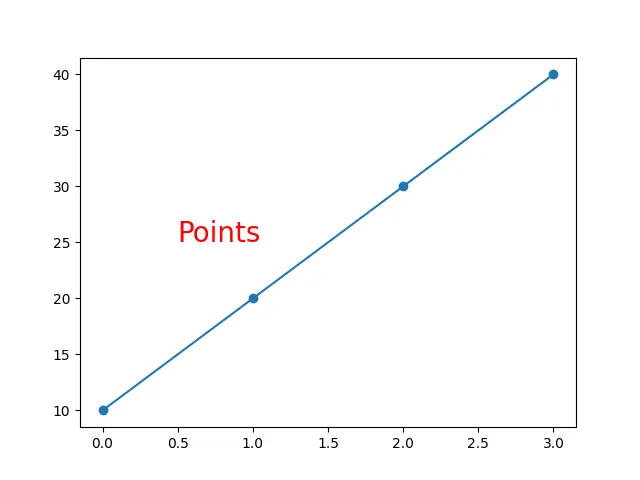
下一个示例使用 xytext 和 *args 参数。
代码:
import matplotlib.pyplot as plot

plot.plot([10, 20, 30, 40], marker="o")

plot.annotate("Points", (1, 20), (0.5, 25), size=20, color="red")
plot.show()
输出:
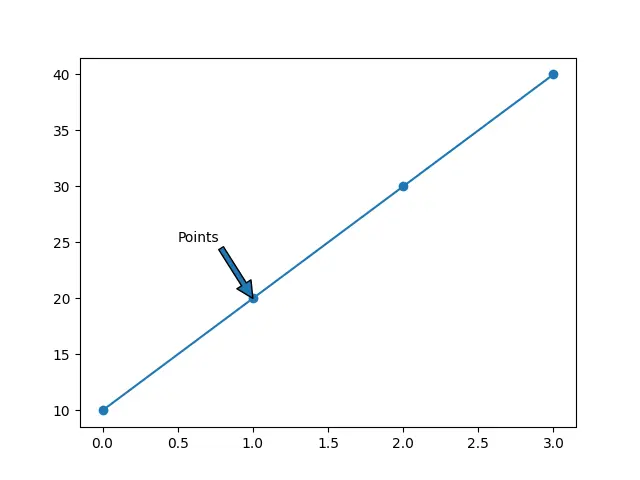
我们可以使用 annotate() 方法的 arrowprops 属性添加箭头。
代码:
import matplotlib.pyplot as plot

plot.plot([10, 20, 30, 40], marker="o")

plot.annotate("Points", (1, 20), (0.5, 25), arrowprops={})
plot.show()
输出:
我们可以使用 arrowstyle 键更改箭头的样式。
代码:
import matplotlib.pyplot as plot

plot.plot([10, 20, 30, 40], marker="o")

plot.annotate("Points", (1, 20), (0.5, 25), arrowprops={"arrowstyle": "<->"})
plot.show()
输出:
![]()
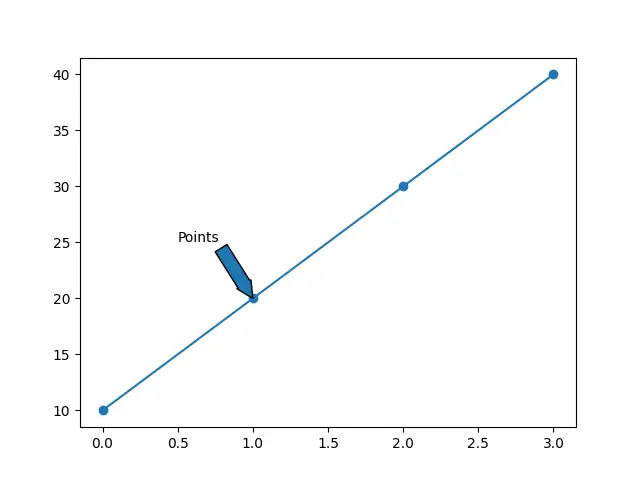
我们也可以使用 width 键来增加箭头的宽度,但是我们不能同时使用 width 和 arrowstyle 键。如果我们这样做,那么我们将得到一个错误。
当我们不使用键作为 arrowstyle 时,我们只能使用这个键。
代码:
import matplotlib.pyplot as plot

plot.plot([10, 20, 30, 40], marker="o")

plot.annotate("Points", (1, 20), (0.5, 25), arrowprops={"width": 10})
plot.show()
输出:
当注释的坐标在轴之外时,我们可以使用 annotation_clip 属性隐藏注释,因此我们需要将布尔值作为 "True" 传递给它,但我们希望看到注释甚至注释坐标被放置在图之外,所以我们通过它"False"。
代码:
import matplotlib.pyplot as plot

plot.plot([10, 20, 30, 40], marker="o")

plot.annotate(
    "Points",
    (1, 20),
    (0.5, 45),
    arrowprops={"arrowstyle": "<->"},
    annotation_clip=False,
)
plot.show()
输出:


Hello! I am Salman Bin Mehmood(Baum), a software developer and I help organizations, address complex problems. My expertise lies within back-end, data science and machine learning. I am a lifelong learner, currently working on metaverse, and enrolled in a course building an AI application with python. I love solving problems and developing bug-free software for people. I write content related to python and hot Technologies.
LinkedIn