Stack Trace in Java
In Java, the stack trace is an array of stacks. The stack trace collects the information of all methods run by a program and tells us the location of exception or error in the console.
The JVM automatically shows the stack trace when an exception is thrown, or an error has occurred.
This tutorial will demonstrate what stack trace is and how to use it to debug our code.
Demonstrate the Stack Trace in Java
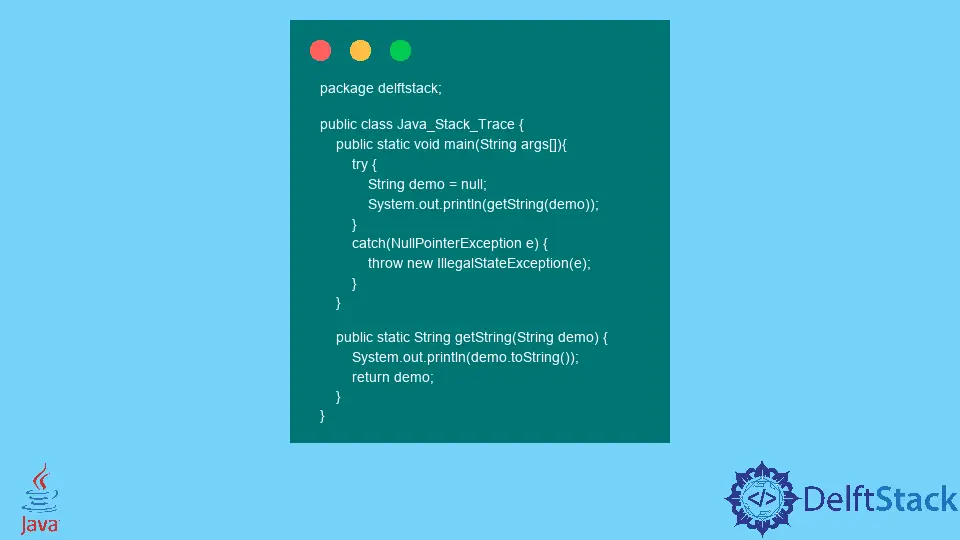
Let’s run a simple example to show the stack trace in Java and then describe it:
package delftstack;

public class Java_Stack_Trace {
  public static void main(String args[]) {
    try {
      String demo = null;
      System.out.println(getString(demo));
    } catch (NullPointerException e) {
      throw new IllegalStateException(e);
    }
  }

  public static String getString(String demo) {
    System.out.println(demo.toString());
    return demo;
  }
}
The code above runs a method to get the string, and we pass a null string as an argument. We try to catch the null pointer exception.
The code will catch the exception and show the trace.
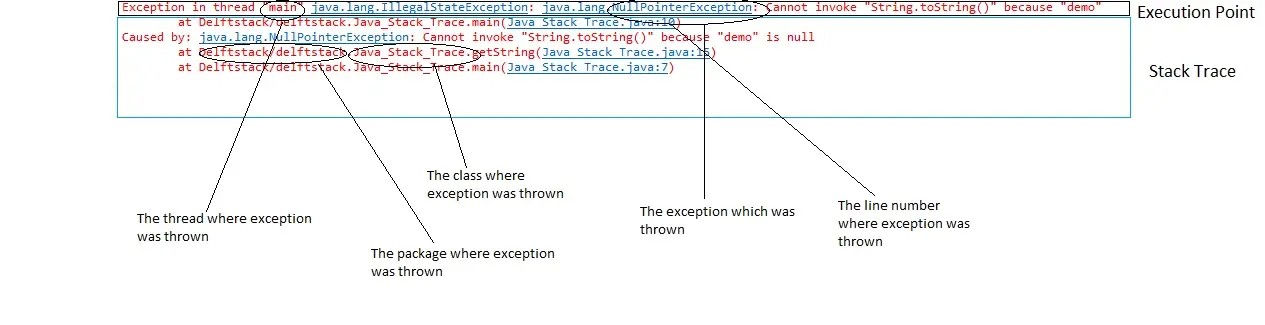
Output:
Exception in thread "main" java.lang.IllegalStateException: java.lang.NullPointerException: Cannot invoke "String.toString()" because "demo" is null
    at Delftstack/delftstack.Java_Stack_Trace.main(Java_Stack_Trace.java:10)
Caused by: java.lang.NullPointerException: Cannot invoke "String.toString()" because "demo" is null
    at Delftstack/delftstack.Java_Stack_Trace.getString(Java_Stack_Trace.java:15)
    at Delftstack/delftstack.Java_Stack_Trace.main(Java_Stack_Trace.java:7)
The output shows the stack trace as the code throws a null pointer exception. The topmost method call with line number 10 is the reason for this exception.
The stack trace also tells us that the null point exception is thrown because the string demo is null at line 7. The picture below further describes this stack trace:
Dump the Stack Trace in Java
The stack trace contains the information of packages, classes, methods, and lines. Java has a built-in function Thread.dumpStack() to dump all the stack trace information.
package delftstack;

public class Java_Stack_Trace {
  public static void main(String args[]) {
    Stack_Trace_Demo();
  }

  static void Stack_Trace_Demo() {
    Stack_Trace_Demo1();
  }
  static void Stack_Trace_Demo1() {
    Stack_Trace_Demo2();
  }
  static void Stack_Trace_Demo2() {
    Stack_Trace_Demo3();
  }
  static void Stack_Trace_Demo3() {
    Stack_Trace_Demo4();
  }
  static void Stack_Trace_Demo4() {
    Thread.dumpStack();
  }
}
The code above contains four demo methods, and then we call the dumpstack() in the last method. It will show all the stack trace information.
Output:
java.lang.Exception: Stack trace
    at java.base/java.lang.Thread.dumpStack(Thread.java:1380)
    at Delftstack/delftstack.Java_Stack_Trace.Stack_Trace_Demo4(Java_Stack_Trace.java:21)
    at Delftstack/delftstack.Java_Stack_Trace.Stack_Trace_Demo3(Java_Stack_Trace.java:18)
    at Delftstack/delftstack.Java_Stack_Trace.Stack_Trace_Demo2(Java_Stack_Trace.java:15)
    at Delftstack/delftstack.Java_Stack_Trace.Stack_Trace_Demo1(Java_Stack_Trace.java:12)
    at Delftstack/delftstack.Java_Stack_Trace.Stack_Trace_Demo(Java_Stack_Trace.java:9)
    at Delftstack/delftstack.Java_Stack_Trace.main(Java_Stack_Trace.java:5)
This stack can also be described the same as described above in the picture.

Sheeraz is a Doctorate fellow in Computer Science at Northwestern Polytechnical University, Xian, China. He has 7 years of Software Development experience in AI, Web, Database, and Desktop technologies. He writes tutorials in Java, PHP, Python, GoLang, R, etc., to help beginners learn the field of Computer Science.
LinkedIn Facebook