How to Debug Java Codes Remotely
- Prerequisites
- Create a Java Application
- Write Java Code
- Java Remote Debugging
- Run the Java Application
- Attach Debugger to a Process
- Java Debug Wire Protocol
We must execute a Java application with specific parameters to allow a remote debugger to attach. We will explore how to set up run/debug configurations that will accomplish the work for us.
Prerequisites
To follow this tutorial, we must have the following things up and running.
- Java 18 and the environment variable must be set.
- IntelliJ IDEA Community Edition IDE (you may also download it from here).
- The IP address and port number of a remote machine (you can also follow this article if working on the local machine)
The remaining tutorial is divided into six sections considering the newbies for this IDE. If you are already using IntelliJ IDEA, you may jump to the desired section; all of them are given below.
- Create a Java Application
- Write Java Code
- Java Remote Debugging
- Run the Java Application
- Attach Debugger to a Process
- Java Debug Wire Protocol
Create a Java Application
Step 1: Open IntelliJ IDEA IDE.
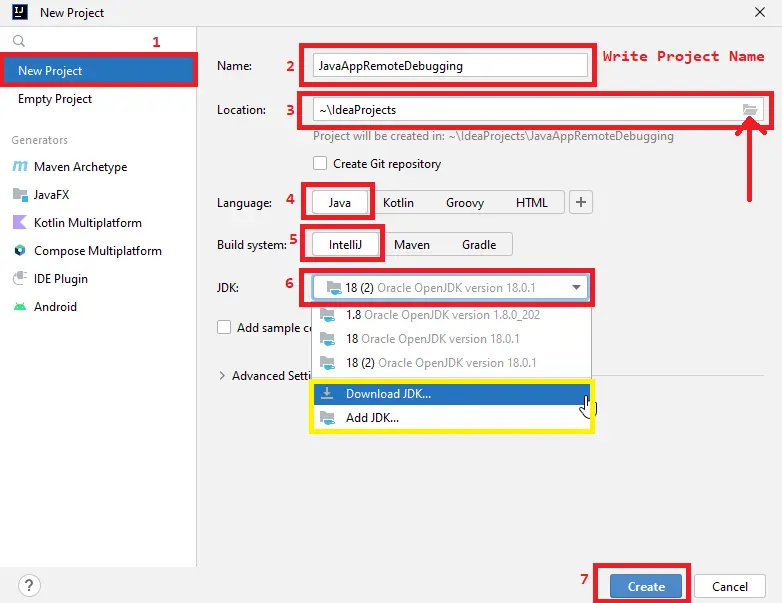
Step 2: Click File -> New -> Project. The following screen will show up, click on New Project, write the project’s name, and set the location where it will be saved.
Ensure the Java language and IntelliJ build system are selected. IntelliJ IDEA automatically detects if you have installed JDK (Java Development Kit) on its default location.
Otherwise, you can browse to add JDK and download it from here without navigating to the browser. Finally, click on the Create button.
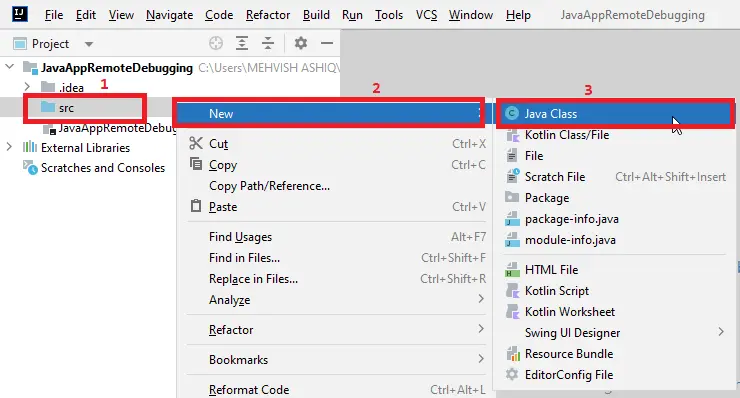
Step 3: Create Java Class by going as right click on src Folder -> New -> Java Class.
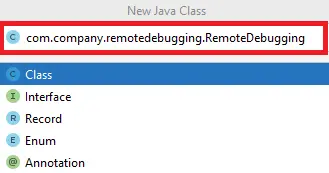
Write the name of the Java class. If you write just the name, it would be created in the default package.
To create a Java class in your desired package, write the name as follows. It will create a package and a file named com.company.remotedebugging and RemoteDebugging.java, respectively.
Write Java Code
Example Code:
// You may have a different package name. Write yours here
package com.company.remotedebugging;

// RemoteDebugging class
public class RemoteDebugging {
  // main method
  public static void main(String[] args) {
    String fullName = "Mehvish Ashiq";
    System.out.println("Star Printing");

    // iterate over the string variable
    for (int i = 0; i < fullName.length(); i++) {
      try {
        // sleep for 500 milliseconds
        Thread.sleep(500);
      } // end try
      catch (InterruptedException e) {
        e.printStackTrace();
      } // end catch
      // print character
      System.out.println(fullName.charAt(i));
    } // end for-loop

    System.out.println("Task Completed!");
  } // end main function
} // end RemoteDebugging Class
Java Remote Debugging
We are only required to do two run/debug configurations, first for running the application and second for attaching to it. Let’s see how we can do that.
Set Up Debugger
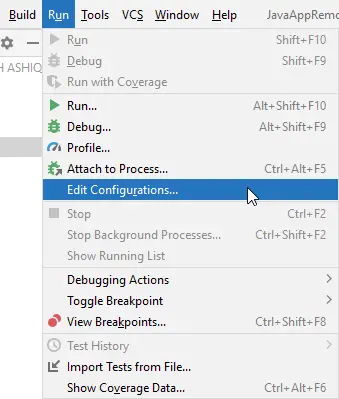
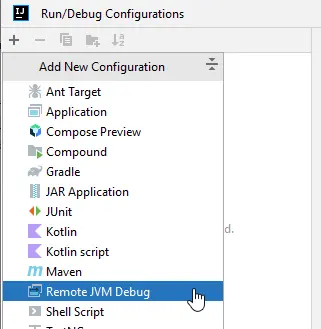
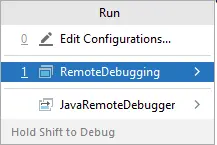
Step 1: Go to Run -> Edit Configurations.
Step 2: Click on the + sign in the top-left corner and select Remote JVM Debug.
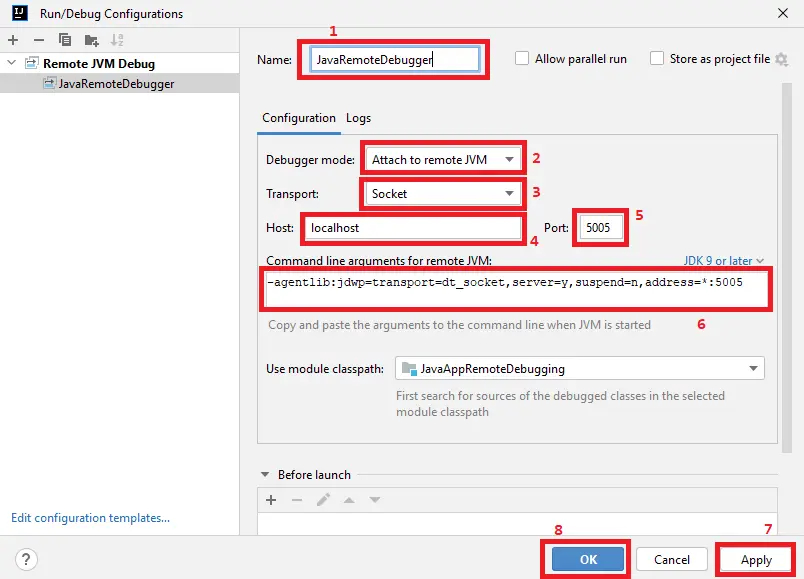
Step 3: We configure a few things. First, write the name to tell how this run configuration will be called.
You can also use the default value, but having a different name to differentiate is good. Ensure that the Attach to remote JVM and Socket are selected for the Debugger mode and Transport options.
Next, write the IP address of a machine where this app will be executed. We will write localhost as we execute on the same machine.
Remember that we will write the IP address if the application runs on a different machine. For instance, the IP will look like 192.168.15.119.
Then, write the port number you want to keep open for a remote connection. Now, copy the command line arguments in a notepad (it will be used later in this tutorial).
These VM options are required by a host application to be started. Click Apply then OK.
See the following screenshot for reference.
Set Up Host Application
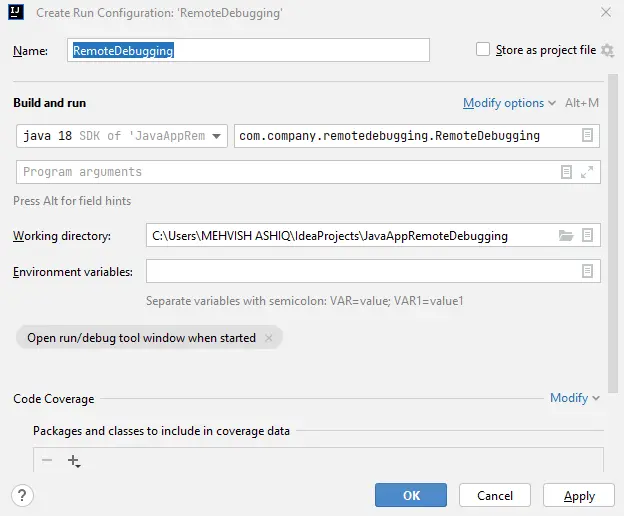
We are using the run/debug configurations to set up our host application, but there are no restrictions on how the host app should run.
Right Click anywhere in the body of your Java Class (in this example, the Java class is RemoteDebugging.java) and select Modify Run Configuration. The following screen will appear.
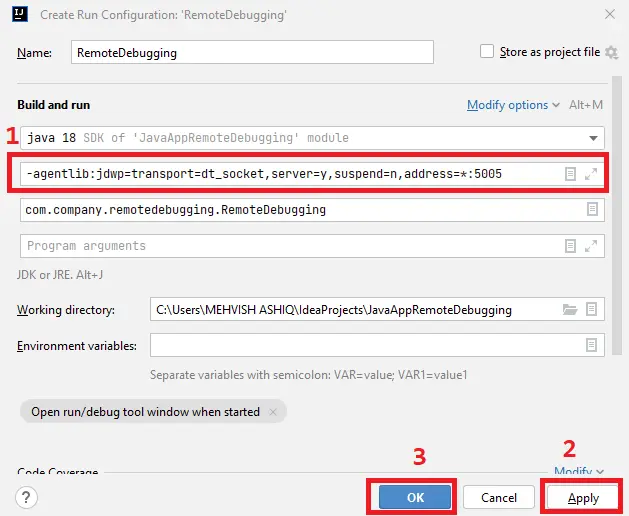
Click on Modify options and select Add VM options, which will open the following screen. Write the command-line arguments you copied in the notepad while setting up the debugger, and paste that as given in the following screenshot.
Finally, click the Apply and then the OK button.
Run the Java Application
Run the application by going to Run -> Run. Make sure your Java class is selected.
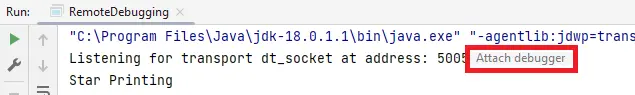
The first line in the program output must be as follows.
Listening for transport dt_socket at the address: 5005
It shows that we have successfully enabled a debug agent. Now, our Java program is ready to accept the incoming debugger connections.
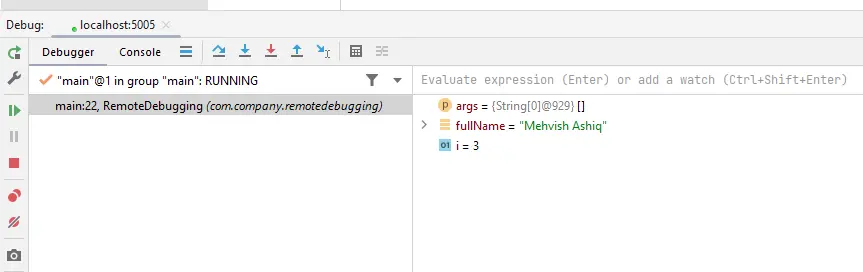
Attach Debugger to a Process
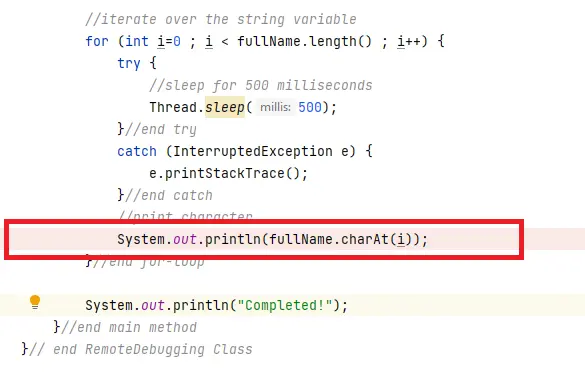
Click the gutter at a line where you want to add the breakpoint. We are adding the breakpoint in the following line, highlighted in the screenshot below.
Run the application by going to Run -> Run as we did in the previous section. In the program output, click on Attach Debugger.
You can find it as shown in the following screenshot.
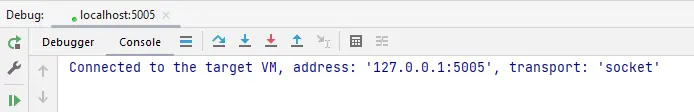
The debugger is attached successfully.
As a result, the program will be suspended as soon as it reaches the breakpoint. You can do any debugging-related actions, for instance, expression evaluation.
Once done, do not forget to close the debugger session by closing the session tab in the Debug tool window or clicking the red square on the left to stop it.
Java Debug Wire Protocol
The Java Debug Wire Protocol (also called JDWP) is a protocol used for communication between a debugger and a debuggee. Here, the debuggee is an application being debugged, while a debugger is a process connecting to an application being debugged.
Remember, both applications can run on different or the same machine. We used JDWP in the JVM command-line arguments to launch the debuggee application.
It requires various parameters (options) that are briefly described below.
- The
transportis the only fully needed option. It denotes which transport mechanism would be used. We are usingdt_socket, which is compatible with every platform and let the processes run on various machines. In contrast,dt_shmemis used if both processes execute on the same machine and we only want to work on Windows. - The
serveroption is not mandatory. When this flag is on, it defines how it attaches to a debugger. It discloses a process by which the address is defined in anaddressoption. Otherwise,JDWPexposes the default one. - The
suspendoption defines whether a JVM (Java Virtual Machine) should suspend and wait for the debugger to attach or not. - The
addressoption has the address and a port number disclosed by a debuggee. This can also denote an address translated to a string of characters (for instance,javadebugif we useserver=ywithout specifying theaddresson Windows).