Crear leyenda personalizada con ggplot en R
-
Utilice el parámetro
legend.positionen la funciónthemepara especificar la posición de la leyenda en R -
Utilice los parámetros
legend.justificationylegend.backgrounden la funciónthemepara crear una leyenda personalizada -
Utilice el parámetro
legend.titleen la funciónthemepara modificar el formato del título de la leyenda
Este artículo demostrará varios métodos para crear una leyenda personalizada con ggplot en R.
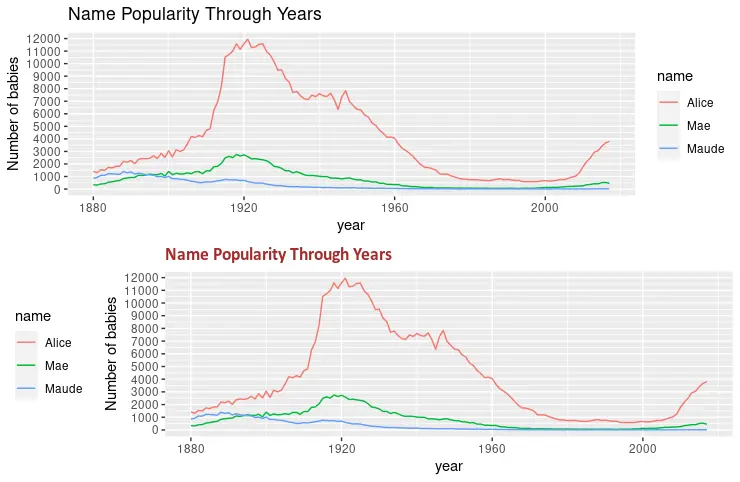
Utilice el parámetro legend.position en la función theme para especificar la posición de la leyenda en R
El parámetro legend.position especifica la posición de la leyenda en el gráfico. Los valores opcionales pueden ser "none", "left", "right", "bottom", "top" o un vector numérico de dos elementos. El parámetro plot.title también se utiliza en el siguiente ejemplo para modificar el título del gráfico. Finalmente, se dibujan dos gráficos al mismo tiempo utilizando la función grid.arrange.
library(ggplot2)
library(gridExtra)
library(babynames)
library(dplyr)

dat <- babynames %>%
  filter(name %in% c("Alice", "Maude", "Mae")) %>%
  filter(sex=="F")

p1 <- ggplot(dat, aes(x = year, y = n, color = name)) +
  geom_line() +
  scale_y_continuous(
    breaks = seq(0, 15000, 1000),
    name = "Number of babies") +
  ggtitle("Name Popularity Through Years")

p2 <- ggplot(dat, aes(x = year, y = n, color = name)) +
  geom_line() +
  scale_y_continuous(
    breaks = seq(0, 15000, 1000),
    name = "Number of babies") +
  theme(
    legend.position = "left",
    plot.title = element_text(
      size = rel(1.2), lineheight = .9,
      family = "Calibri", face = "bold", colour = "brown"
    )) +
  ggtitle("Name Popularity Through Years")

grid.arrange(p1, p2, nrow = 2)
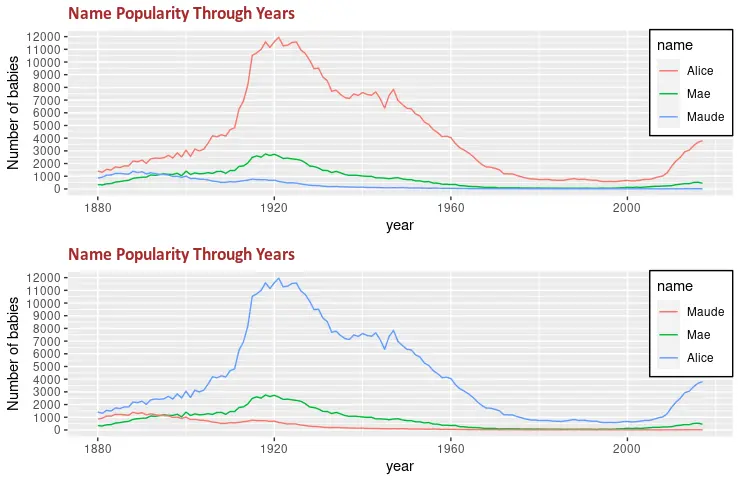
Utilice los parámetros legend.justification y legend.background en la función theme para crear una leyenda personalizada
Otro parámetro útil de la función tema es legend.background que se puede utilizar para formatear el fondo de la leyenda. El siguiente fragmento de código llena el rectángulo de leyenda con color blanco y un trazo negro. Además, legend.justification se combina con legend.position para especificar la posición de la leyenda.
library(ggplot2)
library(gridExtra)
library(babynames)
library(dplyr)

dat <- babynames %>%
  filter(name %in% c("Alice", "Maude", "Mae")) %>%
  filter(sex=="F")

p3 <- ggplot(dat, aes(x = year, y = n, color = name)) +
  geom_line() +
  scale_y_continuous(
    breaks = seq(0, 15000, 1000),
    name = "Number of babies") +
  theme(
    legend.position = c(1, 1),
    legend.justification = c(1, 1),
    legend.background = element_rect(fill = "white", colour = "black"),
    plot.title = element_text(
      size = rel(1.2), lineheight = .9,
      family = "Calibri", face = "bold", colour = "brown"
    )) +
  ggtitle("Name Popularity Through Years")


p4 <- ggplot(dat, aes(x = year, y = n, color = name)) +
  geom_line() +
  scale_color_discrete(limits = c("Maude", "Mae", "Alice")) +
  scale_y_continuous(
    breaks = seq(0, 15000, 1000),
    name = "Number of babies") +
  theme(
    legend.position = c(1, 1),
    legend.justification = c(1, 1),
    legend.background = element_rect(fill = "white", colour = "black"),
    plot.title = element_text(
      size = rel(1.2), lineheight = .9,
      family = "Calibri", face = "bold", colour = "brown"
    )) +
  ggtitle("Name Popularity Through Years")

grid.arrange(p3, p4, nrow = 2)
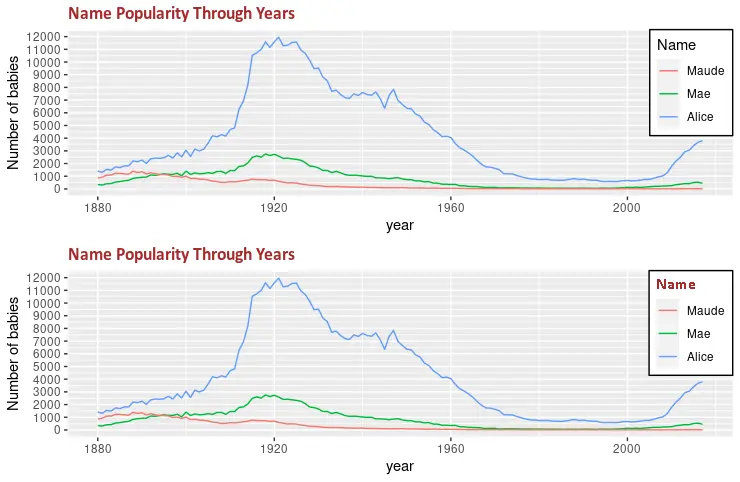
Utilice el parámetro legend.title en la función theme para modificar el formato del título de la leyenda
El parámetro legend.title se puede utilizar para cambiar el formato del título de la leyenda. Se necesita la función element_text con diferentes argumentos para modificar el formato como la familia de fuentes, el color del texto o el tamaño de la fuente. La función grid.arrange se utiliza para demostrar el cambio entre los dos gráficos dibujados.
library(ggplot2)
library(gridExtra)
library(babynames)
library(dplyr)

dat <- babynames %>%
  filter(name %in% c("Alice", "Maude", "Mae")) %>%
  filter(sex=="F")

p5 <- ggplot(dat, aes(x = year, y = n, color = name)) +
  geom_line() +
  scale_color_discrete(limits = c("Maude", "Mae", "Alice")) +
  labs(color = "Name") +
  scale_y_continuous(
    breaks = seq(0, 15000, 1000),
    name = "Number of babies") +
  theme(
    legend.position = c(1, 1),
    legend.justification = c(1, 1),
    legend.background = element_rect(fill = "white", colour = "black"),
    plot.title = element_text(
      size = rel(1.2), lineheight = .9,
      family = "Calibri", face = "bold", colour = "brown"
    )) +
  ggtitle("Name Popularity Through Years")


p6 <- ggplot(dat, aes(x = year, y = n, color = name)) +
  geom_line() +
  scale_color_discrete(limits = c("Maude", "Mae", "Alice")) +
  labs(color = "Name") +
  scale_y_continuous(
    breaks = seq(0, 15000, 1000),
    name = "Number of babies") +
  theme(
    legend.title = element_text(
      family = "Calibri",
      colour = "brown",
      face = "bold",
      size = 12),
    legend.position = c(1, 1),
    legend.justification = c(1, 1),
    legend.background = element_rect(fill = "white", colour = "black"),
    plot.title = element_text(
      size = rel(1.2), lineheight = .9,
      family = "Calibri", face = "bold", colour = "brown"
    )) +
  ggtitle("Name Popularity Through Years")

grid.arrange(p5, p6, nrow = 2)

Founder of DelftStack.com. Jinku has worked in the robotics and automotive industries for over 8 years. He sharpened his coding skills when he needed to do the automatic testing, data collection from remote servers and report creation from the endurance test. He is from an electrical/electronics engineering background but has expanded his interest to embedded electronics, embedded programming and front-/back-end programming.
LinkedIn Facebook