Crea legenda personalizzata con ggplot in R
-
Utilizzare il parametro
legend.positionnella funzionethemeper specificare la posizione della legenda in R -
Usa i parametri
legend.justificationelegend.backgroundnella funzionethemeper creare una legenda personalizzata -
Usa il parametro
legend.titlenella funzionethemeper modificare la formattazione del titolo della legenda
Questo articolo dimostrerà più metodi per creare una legenda personalizzata con ggplot in R.
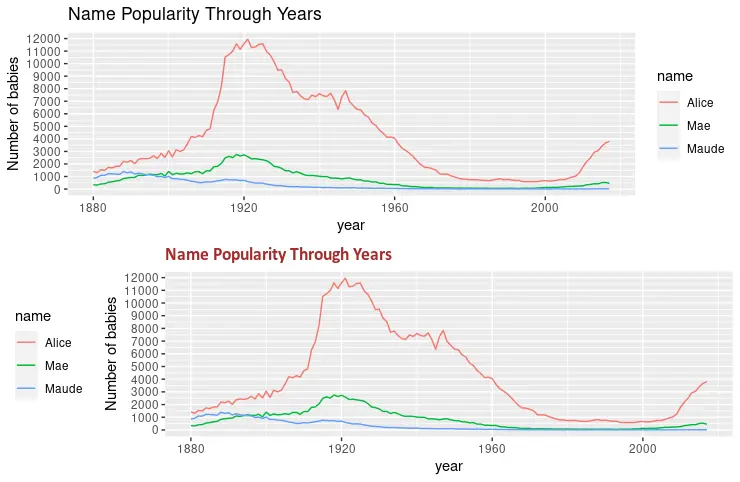
Utilizzare il parametro legend.position nella funzione theme per specificare la posizione della legenda in R
Il parametro legend.position specifica la posizione della legenda nel grafico. I valori opzionali possono essere "none", "left", "right", "bottom", "top" o vettore numerico a due elementi. Il parametro plot.title viene utilizzato anche nell’esempio seguente per modificare il titolo della trama. Infine, vengono tracciati due grafici contemporaneamente utilizzando la funzione grid.arrange.
library(ggplot2)
library(gridExtra)
library(babynames)
library(dplyr)

dat <- babynames %>%
  filter(name %in% c("Alice", "Maude", "Mae")) %>%
  filter(sex=="F")

p1 <- ggplot(dat, aes(x = year, y = n, color = name)) +
  geom_line() +
  scale_y_continuous(
    breaks = seq(0, 15000, 1000),
    name = "Number of babies") +
  ggtitle("Name Popularity Through Years")

p2 <- ggplot(dat, aes(x = year, y = n, color = name)) +
  geom_line() +
  scale_y_continuous(
    breaks = seq(0, 15000, 1000),
    name = "Number of babies") +
  theme(
    legend.position = "left",
    plot.title = element_text(
      size = rel(1.2), lineheight = .9,
      family = "Calibri", face = "bold", colour = "brown"
    )) +
  ggtitle("Name Popularity Through Years")

grid.arrange(p1, p2, nrow = 2)
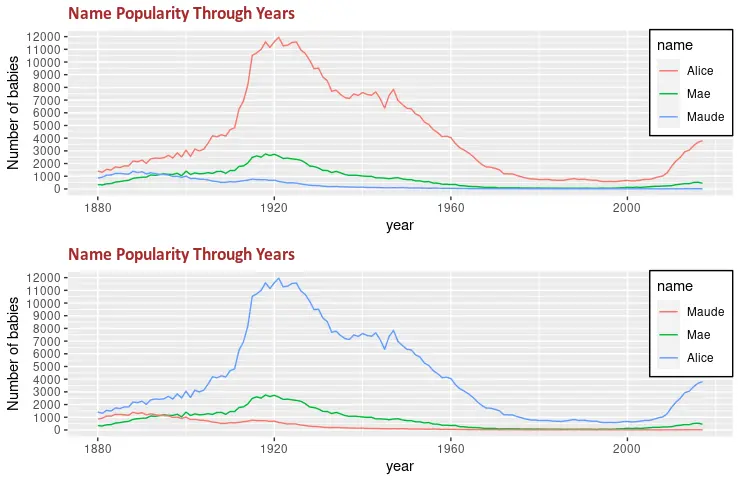
Usa i parametri legend.justification e legend.background nella funzione theme per creare una legenda personalizzata
Un altro parametro utile della funzione tema è legend.background che può essere utilizzato per formattare lo sfondo della legenda. Il seguente frammento di codice riempie il rettangolo della legenda con il colore bianco e un tratto nero. Inoltre, legend.justification è combinato con legend.position per specificare la posizione della legenda.
library(ggplot2)
library(gridExtra)
library(babynames)
library(dplyr)

dat <- babynames %>%
  filter(name %in% c("Alice", "Maude", "Mae")) %>%
  filter(sex=="F")

p3 <- ggplot(dat, aes(x = year, y = n, color = name)) +
  geom_line() +
  scale_y_continuous(
    breaks = seq(0, 15000, 1000),
    name = "Number of babies") +
  theme(
    legend.position = c(1, 1),
    legend.justification = c(1, 1),
    legend.background = element_rect(fill = "white", colour = "black"),
    plot.title = element_text(
      size = rel(1.2), lineheight = .9,
      family = "Calibri", face = "bold", colour = "brown"
    )) +
  ggtitle("Name Popularity Through Years")


p4 <- ggplot(dat, aes(x = year, y = n, color = name)) +
  geom_line() +
  scale_color_discrete(limits = c("Maude", "Mae", "Alice")) +
  scale_y_continuous(
    breaks = seq(0, 15000, 1000),
    name = "Number of babies") +
  theme(
    legend.position = c(1, 1),
    legend.justification = c(1, 1),
    legend.background = element_rect(fill = "white", colour = "black"),
    plot.title = element_text(
      size = rel(1.2), lineheight = .9,
      family = "Calibri", face = "bold", colour = "brown"
    )) +
  ggtitle("Name Popularity Through Years")

grid.arrange(p3, p4, nrow = 2)
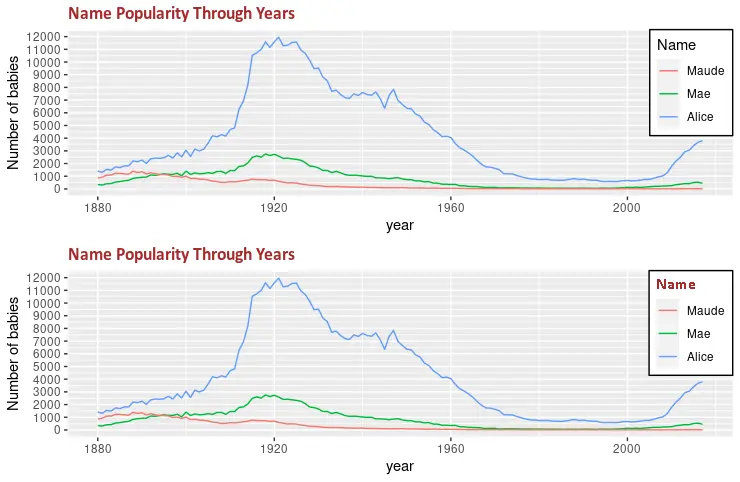
Usa il parametro legend.title nella funzione theme per modificare la formattazione del titolo della legenda
Il parametro legend.title può essere utilizzato per modificare la formattazione del titolo della legenda. Ci vuole la funzione element_text con diversi argomenti per modificare la formattazione come la famiglia di caratteri, il colore del testo o la dimensione del carattere. La funzione grid.arrange viene utilizzata per dimostrare il cambiamento tra i due grafici disegnati.
library(ggplot2)
library(gridExtra)
library(babynames)
library(dplyr)

dat <- babynames %>%
  filter(name %in% c("Alice", "Maude", "Mae")) %>%
  filter(sex=="F")

p5 <- ggplot(dat, aes(x = year, y = n, color = name)) +
  geom_line() +
  scale_color_discrete(limits = c("Maude", "Mae", "Alice")) +
  labs(color = "Name") +
  scale_y_continuous(
    breaks = seq(0, 15000, 1000),
    name = "Number of babies") +
  theme(
    legend.position = c(1, 1),
    legend.justification = c(1, 1),
    legend.background = element_rect(fill = "white", colour = "black"),
    plot.title = element_text(
      size = rel(1.2), lineheight = .9,
      family = "Calibri", face = "bold", colour = "brown"
    )) +
  ggtitle("Name Popularity Through Years")


p6 <- ggplot(dat, aes(x = year, y = n, color = name)) +
  geom_line() +
  scale_color_discrete(limits = c("Maude", "Mae", "Alice")) +
  labs(color = "Name") +
  scale_y_continuous(
    breaks = seq(0, 15000, 1000),
    name = "Number of babies") +
  theme(
    legend.title = element_text(
      family = "Calibri",
      colour = "brown",
      face = "bold",
      size = 12),
    legend.position = c(1, 1),
    legend.justification = c(1, 1),
    legend.background = element_rect(fill = "white", colour = "black"),
    plot.title = element_text(
      size = rel(1.2), lineheight = .9,
      family = "Calibri", face = "bold", colour = "brown"
    )) +
  ggtitle("Name Popularity Through Years")

grid.arrange(p5, p6, nrow = 2)

Founder of DelftStack.com. Jinku has worked in the robotics and automotive industries for over 8 years. He sharpened his coding skills when he needed to do the automatic testing, data collection from remote servers and report creation from the endurance test. He is from an electrical/electronics engineering background but has expanded his interest to embedded electronics, embedded programming and front-/back-end programming.
LinkedIn Facebook