在 Matplotlib 中设置 X 轴刻度值
Suraj Joshi
2020年11月24日
Matplotlib
Matplotlib Axes

我们可以使用 matplotlib.pyplot.xticks() 方法来设置 X 轴的刻度值。
import matplotlib.pyplot as plt

x = [1, 2, 3, 4, 5, 7]
y = [2, 1, 6, 4, 8, 5]

plt.plot(x, y, marker="o")
plt.xlabel("X-Axis")
plt.ylabel("Y-Axis")
plt.title("Figure with default X labels")
plt.show()
输出:
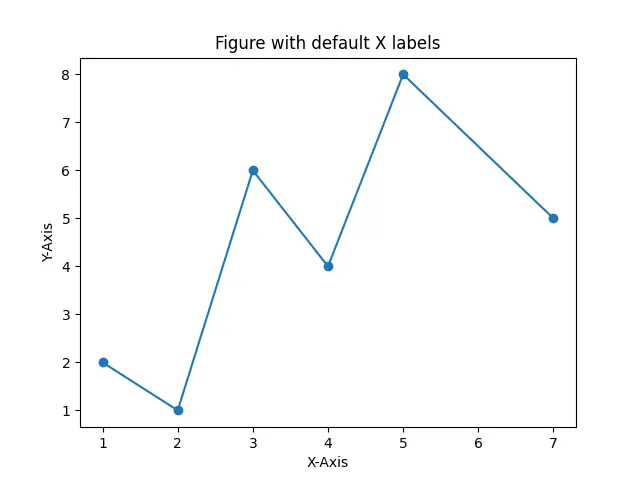
它为 X 轴和 Y 轴生成一个带有默认标签的图形。默认情况下,X 轴和 Y 轴的标签被分配为等距的值,范围从各自轴的最小值到最大值。要改变 X 轴标签的默认值,我们使用 matplotlib.pyplot.xticks() 方法。
使用 matplotlib.pyplot.xticks() 方法设置 X 轴刻度值
import matplotlib.pyplot as plt

x = [1, 2, 3, 4, 5, 7]
y = [2, 1, 6, 4, 8, 5]

values = ["A", "B", "C", "D", "E", "F"]

plt.plot(x, y, marker="o")
plt.xlabel("X-Axis")
plt.ylabel("Y-Axis")
plt.title("Set X labels in Matplotlib Plot")
plt.xticks(x, values)
plt.show()
输出:
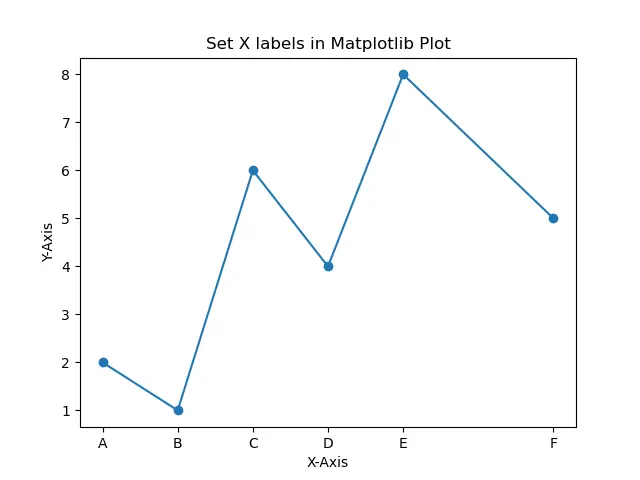
它将 X 轴标签的刻度值设置为列表 values 中的值。values 中的每个元素都将作为 X 轴刻度,作为列表 x 中相应元素的刻度。
刻度的间距也将根据用于绘图的元素间距来确定。
import matplotlib.pyplot as plt

x = [0.01, 0.1, 1, 10, 100]
y = [2, 1, 6, 4, 8]

values = ["A", "B", "C", "D", "E", "F"]

plt.plot(x, y, marker="o")
plt.xlabel("X-Axis")
plt.ylabel("Y-Axis")
plt.title("Set X labels in Matplotlib Plot")
plt.xticks(x, values)
plt.show()
输出:
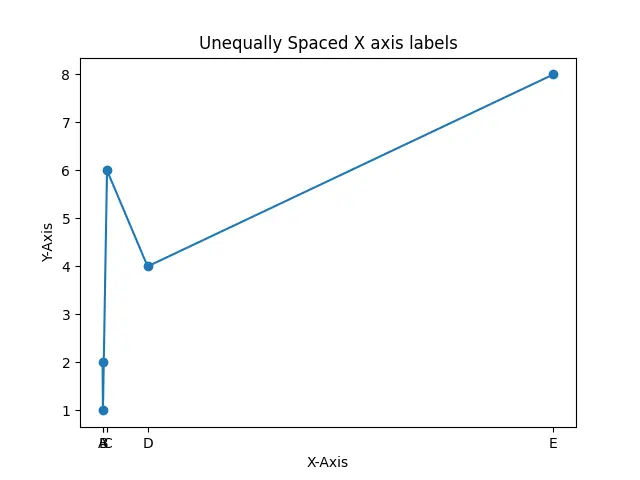
如果沿 X 轴绘制的数值不是等距的,那么沿 X 轴的标签也将是不等距的,我们可能得不到一个清晰的数字,如上图输出图所示。
我们可以使用沿 X 轴等距的任意值列表来绘制数据,然后将实际值作为刻度分配到 X 轴上。
import matplotlib.pyplot as plt

x = [0.01, 0.1, 1, 10, 100]
y = [2, 1, 6, 4, 8]
values = range(len(x))

plt.plot(values, y, marker="o")
plt.xlabel("X-Axis")
plt.ylabel("Y-Axis")
plt.title("Set X labels in Matplotlib Plot")
plt.xticks(values, x)
plt.show()
输出:

它将等距放置的 X 轴标签设置为 X 轴刻度值不相等的图。
Enjoying our tutorials? Subscribe to DelftStack on YouTube to support us in creating more high-quality video guides. Subscribe
作者: Suraj Joshi

Suraj Joshi is a backend software engineer at Matrice.ai.
LinkedIn