Python 中的 Matplotlib.pyplot.specgram()来绘制频谱图
Suraj Joshi
2024年2月15日
Matplotlib
Matplotlib spectogram

本教程介绍了我们如何使用 matplotlib.pyplot.specgram() 和 scipy.signal.spectrogram() 方法在 Python 中绘制频谱图。
我们可以通过频谱图得到信号强度的详细信息。频谱图中某一点的颜色越深,说明该点的信号越强。
使用 matplotlib.pyplot.specgram() 方法绘制频谱图
matplotlib.pyplot.specgram(x,
                           NFFT=None,
                           Fs=None,
                           Fc=None,
                           detrend=None,
                           window=None,
                           noverlap=None,
                           cmap=None,
                           xextent=None,
                           pad_to=None,
                           sides=None,
                           scale_by_freq=None,
                           mode=None,
                           scale=None,
                           vmin=None,
                           vmax=None, *,
                           data=None,
                           **kwargs)
示例: 使用 matplotlib.pyplot.specgram() 方法绘制频谱图
import math
import numpy as np
import matplotlib.pyplot as plt

dt = 0.0001
w = 2
t = np.linspace(0, 5, math.ceil(5 / dt))
A = 20 * (np.sin(3 * np.pi * t))

plt.specgram(A, Fs=1)
plt.title("Spectrogram Using matplotlib.pyplot.specgram() method")
plt.show()
输出:
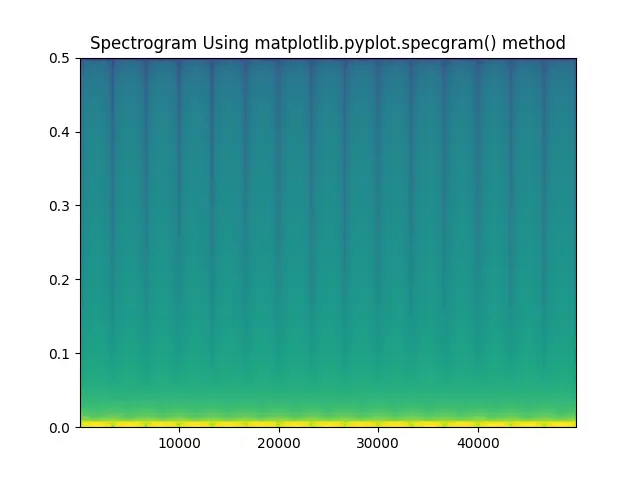
它使用 matplotlib.pyplot.specgram() 方法为函数 A=20sin(3*np.pi*t) 创建一个频谱图。该方法中的参数 fs 代表采样频率。
使用 scipy.signal.spectrogram() 方法绘制频谱图
import math
import numpy as np
import matplotlib.pyplot as plt
from scipy import signal

dt = 0.0001
w = 2
t = np.linspace(0, 5, math.ceil(5 / dt))
A = 2 * (np.sin(1 * np.pi * 300 * t))

f, t, Sxx = signal.spectrogram(A, fs=1, nfft=514)
plt.pcolormesh(t, f, Sxx)
plt.ylabel("Frequency")
plt.xlabel("Time")
plt.title("Spectrogram Using scipy.signal.spectrogram() method")
plt.show()
输出:

它使用 scipy.signal.spectrogram() 方法为函数 A=2sin(300*np.pi*t) 创建一个频谱图。该方法中的参数 fs 代表采样频率,ntft 代表所用 FFT 的长度。
该方法返回三个值 f、t 和 Sxx。f 代表采样频率数组,t 代表采样时间数组,Sxx 代表 A 的频谱图。
这种方法并不能生成输入信号的频谱图。我们可以使用 matplotlib.pyplot.colormesh() 来生成图形。
Enjoying our tutorials? Subscribe to DelftStack on YouTube to support us in creating more high-quality video guides. Subscribe
作者: Suraj Joshi

Suraj Joshi is a backend software engineer at Matrice.ai.
LinkedIn