Python での Matplotlib.pyplot.specgram()
Suraj Joshi
2023年1月30日
Matplotlib
Matplotlib spectogram

このチュートリアルでは、matplotlib.pyplot.specgram() メソッドと scipy.signal.spectrogram() メソッドを使って Python でスペクトログラムをプロットする方法を説明します。
スペクトログラムを使って信号の強さの詳細を得ることができます。スペクトログラムの色が濃いほど、その点での信号が強いことを示しています。
matplotlib.pyplot.specgram() メソッドを用いたスペクトログラムのプロット
matplotlib.pyplot.specgram(x,
                           NFFT=None,
                           Fs=None,
                           Fc=None,
                           detrend=None,
                           window=None,
                           noverlap=None,
                           cmap=None,
                           xextent=None,
                           pad_to=None,
                           sides=None,
                           scale_by_freq=None,
                           mode=None,
                           scale=None,
                           vmin=None,
                           vmax=None, *,
                           data=None,
                           **kwargs)
例:matplotlib.pyplot.specgram() メソッドを用いた分光図のプロット
import math
import numpy as np
import matplotlib.pyplot as plt

dt = 0.0001
w = 2
t = np.linspace(0, 5, math.ceil(5 / dt))
A = 20 * (np.sin(3 * np.pi * t))

plt.specgram(A, Fs=1)
plt.title("Spectrogram Using matplotlib.pyplot.specgram() method")
plt.show()
出力:
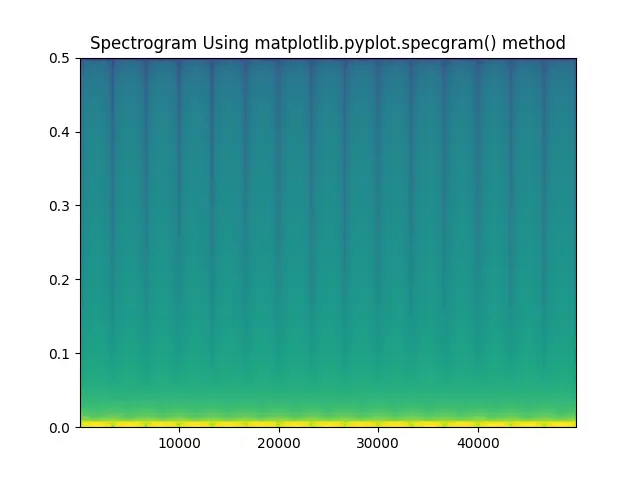
関数 A=20sin(3*np.pi*t) のスペクトルグラムを matplotlib.pyplot.specgram() メソッドを用いて作成します。このメソッドの引数 fs はサンプリング周波数を表します。
scipy.signal.spectrogram() メソッドを用いたスペクトログラムのプロット
import math
import numpy as np
import matplotlib.pyplot as plt
from scipy import signal

dt = 0.0001
w = 2
t = np.linspace(0, 5, math.ceil(5 / dt))
A = 2 * (np.sin(1 * np.pi * 300 * t))

f, t, Sxx = signal.spectrogram(A, fs=1, nfft=514)
plt.pcolormesh(t, f, Sxx)
plt.ylabel("Frequency")
plt.xlabel("Time")
plt.title("Spectrogram Using scipy.signal.spectrogram() method")
plt.show()
出力:

関数 A=2sin(300*np.pi*t) のスペクトルグラムを scipy.signal.spectrogram() メソッドを用いて作成します。メソッドの引数 fs はサンプリング周波数を、ntft は使用する FFT の長さを表します。
このメソッドは f、t、Sxx の 3つの値を返します。f はサンプル周波数の配列、t はサンプル時間の配列、Sxx は A のスペクトルグラムを表します。
このメソッドは入力信号のスペクトログラムプロットを生成しません。図を生成するには matplotlib.pyplot.colormesh() を用いることができます。
チュートリアルを楽しんでいますか? <a href="https://www.youtube.com/@delftstack/?sub_confirmation=1" style="color: #a94442; font-weight: bold; text-decoration: underline;">DelftStackをチャンネル登録</a> して、高品質な動画ガイドをさらに制作するためのサポートをお願いします。 Subscribe
著者: Suraj Joshi

Suraj Joshi is a backend software engineer at Matrice.ai.
LinkedIn