Python NumPy numpy.histogram() 函数
Minahil Noor
2023年1月30日
NumPy
-
numpy.histogram()语法 -
示例代码:
numpy.histogram() -
示例代码:
numpy.histogram()指定bins的数量和大小 -
示例代码:
numpy.histogram()使用density参数 -
示例代码:
numpy.histogram()绘制直方图

Python NumPy numpy.histogram() 函数生成直方图的值。它不绘制直方图,但它计算其值。我们传递一个数组作为参数。这个函数计算出它的直方图,并返回一个存储了直方图值的数组。我们可以说,它返回的是直方图的数值表示。
numpy.histogram() 语法
numpy.histogram(a, bins=10, range=None, normed=None, weights=None, density=None)
参数
a |
它是一个类似数组的结构。它代表计算直方图的输入数据。 |
bins |
它是一个整数、字符串或一个标量序列。它代表 bin 的数量。一个 bin 就像一个范围,例如,0-5,6-10 等。如果 bin 是一个整数,那么它表示等间距的 bin 的数量。如果它是一个字符串,那么它代表计算 bin 空间的方法。如果它是一个序列,那么它代表不同宽度的 bin。 |
range |
它是以浮点数给出的范围。它代表了 bin 的上限和下限。如果没有给定范围,那么 [a.min(), a.max()] 就是范围。 |
normed |
它是一个布尔值参数。它的功能类似于 density 参数,但如果各仓的间距不相等,就会产生不正确的结果。 |
weights |
它是一个类似于数组的结构。其大小与 a 相同。如果 density 为 True,那么权重将被归一化。 |
density |
它是一个布尔值参数。如果它的值为 True,那么它计算的是概率,而不是计算频率。 |
返回值
它返回两个数组:hist 和 bin_edges。数组 hist 显示直方图的值,bin_edges 显示 bin 边缘。bin_edges 的大小总是 1+(hist 的大小),即 length(hist)+1。
示例代码:numpy.histogram()
参数 a 是一个强制参数。如果我们在执行这个函数时没有传入 bin 的数量,那么它将计算出十个不等距的 bin。
import numpy as np

a = np.array(
    [89, 34, 56, 87, 90, 23, 45, 12, 65, 78, 9, 34, 12, 11, 2, 65, 78, 82, 28, 78]
)

histogram = np.histogram(a)
print(histogram)
输出:
(
    array([2, 3, 2, 2, 1, 0, 1, 2, 3, 4], dtype=int64),
    array([2.0, 10.8, 19.6, 28.4, 37.2, 46.0, 54.8, 63.6, 72.4, 81.2, 90.0]),
)
示例代码:numpy.histogram() 指定 bins 的数量和大小
我们先指定 bins。
import numpy as np

a = np.array(
    [89, 34, 56, 87, 90, 23, 45, 12, 65, 78, 9, 34, 12, 11, 2, 65, 78, 82, 28, 78]
)

histogram = np.histogram(a, bins=2)
print(histogram)
输出:
(array([10, 10], dtype=int64), array([ 2., 46., 90.]))
上面的代码计算出了一个有 2 个 bins 的直方图。分区是 [2., 46.) 和 [46., 90.)。
现在,我们将指定直方格的边缘。
import numpy as np

a = np.array(
    [89, 34, 56, 87, 90, 23, 45, 12, 65, 78, 9, 34, 12, 11, 2, 65, 78, 82, 28, 78]
)

histogram = np.histogram(a, bins=[0, 30, 60, 90])
print(histogram)
输出:
(array([7, 4, 9]), array([0, 30, 60, 90]))
示例代码:numpy.histogram() 使用 density 参数
import numpy as np

a = np.array(
    [89, 34, 56, 87, 90, 23, 45, 12, 65, 78, 9, 34, 12, 11, 2, 65, 78, 82, 28, 78]
)

histogram = np.histogram(a, bins=5, density=True)
print(histogram)
输出:
(array([ 0.01420455,  0.01136364,  0.00284091,  0.00852273,  0.01988636]),
 array([  2. ,  19.6,  37.2,  54.8,  72.4,  90. ]))
请注意,该函数不是计算直方图的值,而是生成概率。
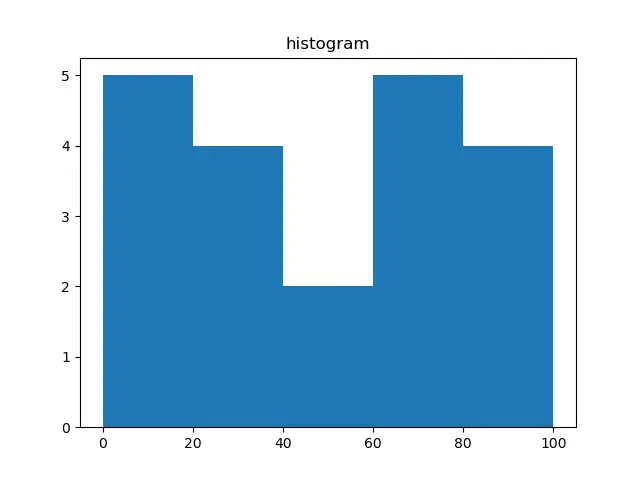
示例代码:numpy.histogram() 绘制直方图
我们可以使用 pyplot 绘制直方图。
from matplotlib import pyplot as plt
import numpy as np

a = np.array(
    [89, 34, 56, 87, 90, 23, 45, 12, 65, 78, 9, 34, 12, 11, 2, 65, 78, 82, 28, 78]
)

plt.hist(a, bins=[0, 20, 40, 60, 80, 100])
plt.title("histogram")
plt.show()
输出:
Enjoying our tutorials? Subscribe to DelftStack on YouTube to support us in creating more high-quality video guides. Subscribe