HOWTO · R
R 中的分段迴歸
本教程演示如何在 R 中執行分段迴歸。
本頁內容
當資料中有明確的斷點時,使用分段迴歸。本教程演示如何在 R 中執行分段迴歸。
R 中的分段迴歸
當資料中有明確的斷點時,將起作用的迴歸將是分段迴歸。分段迴歸是一步一步的過程,如下所示:
-
建立資料框。
-
擬合資料的線性迴歸模型。我們可以使用
lm()方法來做到這一點。 -
擬合分段迴歸模型。
segmented()方法從segmented包中用於擬合分段迴歸模型。 -
使用
plot()方法視覺化最終的分段迴歸模型。
現在讓我們嘗試使用上述步驟的示例。參見示例:
#Step 1
#create the DataFrame
data<-read.table(text="
Year    Stopped
2015    973
2016    1025
2017    1151
2018    1384
2019    4507
2020    15557
", header=T, sep="")

#first six rows of the data frame
head(data)


#Step2
#fit the simple linear regression model
dput(names(data))
q.lm <- lm(log(Stopped) ~ Year, data)
summary(q.lm)


#Step3
#fit the piecewise regression model to original model,
#estimating a breakpoint at x=14
install.packages('segmented')
library(segmented)

o <- segmented(q.lm, seg.Z = ~Year, psi = 2018)

# view the summary
summary(o)


#Step4
# visulize the piecewise regression model
plot(o)
points(log(Stopped) ~ Year, data)
上面的程式碼為在不同年份停止學習的人建立了一個分段迴歸模型。該程式碼有一些輸出,如下所述:
第 1 步的輸出:
  Year Stopped
1 2015     973
2 2016    1025
3 2017    1151
4 2018    1384
5 2019    4507
6 2020   15557
它顯示了資料的頭部。
第 2 步的輸出:
Call:
lm(formula = log(Stopped) ~ Year, data = data)

Residuals:
       1        2        3        4        5        6
 0.50759  0.03146 -0.38079 -0.72463 -0.07216  0.63853

Coefficients:
              Estimate Std. Error t value Pr(>|t|)
(Intercept) -1057.9257   279.3081  -3.788   0.0193 *
Year            0.5282     0.1384   3.815   0.0189 *
---
Signif. codes:  0 '***' 0.001 '**' 0.01 '*' 0.05 '.' 0.1 ' ' 1

Residual standard error: 0.5791 on 4 degrees of freedom
Multiple R-squared:  0.7844,	Adjusted R-squared:  0.7305
F-statistic: 14.56 on 1 and 4 DF,  p-value: 0.01886
這顯示了線性迴歸模型的摘要。
第 3 步的輸出:
***Regression Model with Segmented Relationship(s)***

Call:
segmented.lm(obj = q.lm, seg.Z = ~Year, psi = 2018)

Estimated Break-Point(s):
              Est. St.Err
psi1.Year 2017.91  0.039

Meaningful coefficients of the linear terms:
              Estimate Std. Error t value Pr(>|t|)
(Intercept) -162.39260   35.56716  -4.566   0.0448 *
Year           0.08400    0.01764   4.761   0.0414 *
U1.Year        1.12577    0.02495  45.121       NA
---
Signif. codes:  0 '***' 0.001 '**' 0.01 '*' 0.05 '.' 0.1 ' ' 1

Residual standard error: 0.02495 on 2 degrees of freedom
Multiple R-Squared: 0.9998,  Adjusted R-squared: 0.9995

Boot restarting based on 6 samples. Last fit:
Convergence attained in 1 iterations (rel. change 3.7909e-16)
這適合分段迴歸模型並顯示模型的摘要。該模型在 2017.91 年檢測到一個斷點。
第 4 步的輸出:
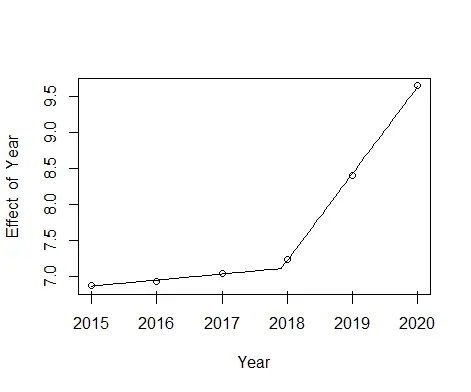
它視覺化分段迴歸模型。該圖顯示分段迴歸模型非常適合給定資料。