在 Matplotlib 條形圖上新增值標籤
Matplotlib 條形圖是在 Python 中視覺化資料的好方法。在條形圖中,我們經常需要新增標籤來視覺化資料。本文將介紹在 Matplotlib 條形圖上新增值標籤的各種方法。
使用 pyplot.text() 方法在 Matplotlib 條形圖上新增值標籤
要在 Matplotlib 條形圖上新增值標籤,我們可以使用 pyplot.text() 函式。
Matplotlib 模組中的 pyplot.text() 函式用於將文字值新增到圖中的任何位置。pyplot.text() 函式的語法如下。
matplotlib.pyplot.text(x, y, s, fontdict=None, **kwargs)
這裡,
- 引數
x和y是放置文字的圖形座標。引數s包含文字字串。 - 引數
fontdict用於更改文字的字型和大小等屬性。它的預設值是None。 **kwargs參數列示用於確定條形圖中文字位置的其他引數。
在本文中,我們將使用引數 ha 來決定文字的水平對齊方式。你可以從 text() 函式的官方文件 中更深入地瞭解該函式的其他引數。
現在讓我們繪製一個條形圖,然後為其新增值標籤。假設我們有一所學校從班級 1 到班級 10 的一個班級的學生人數資料以列表的形式如下。
no_of_students = [10, 24, 45, 30, 23, 56, 67, 34, 45, 50]
這裡,索引 i 代表班級 i+1 的學生人數。為了繪製資料,我們將建立一個列表 class_number,其中包含從 1 到 10 的數字。之後,我們將使用 pyplot.bar() 函式繪製條形圖。然後,我們將分別使用 title()、xlabel() 和 ylabel() 函式將 title、xlabel 和 ylabel 新增到圖中。
為了新增值標籤,我們將定義一個函式 add_value_label(x_list,y_list)。這裡,x_list 和 y_list 是包含 x 軸和 y 軸資料的列表,即 class_number 和 no_of_students。
在函式 add_value_label() 中,我們將值標籤的座標指定為 (x, the height of the bar chart at x),以便將值標籤新增到條形圖的頂部。傳遞給 text 函式的文字值將是條形圖在 x 處的高度。此處,x 將是 class_number 的元素,而 the height of bar chart at x 將是班級 x 中相應的學生人數。
例如,我們將每個班級的學生人數作為值標籤新增到條形圖的頂部。
import matplotlib.pyplot as plt


def add_value_label(x_list, y_list):
    for i in range(1, len(x_list) + 1):
        plt.text(i, y_list[i - 1], y_list[i - 1])


no_of_students = [10, 24, 45, 30, 23, 56, 67, 34, 45, 50]
class_number = [1, 2, 3, 4, 5, 6, 7, 8, 9, 10]
plt.bar(class_number, no_of_students)
add_value_label(class_number, no_of_students)
plt.title("No of Students in a class")
plt.xlabel("Class")
plt.ylabel("Number of Students")
plt.show()
輸出:
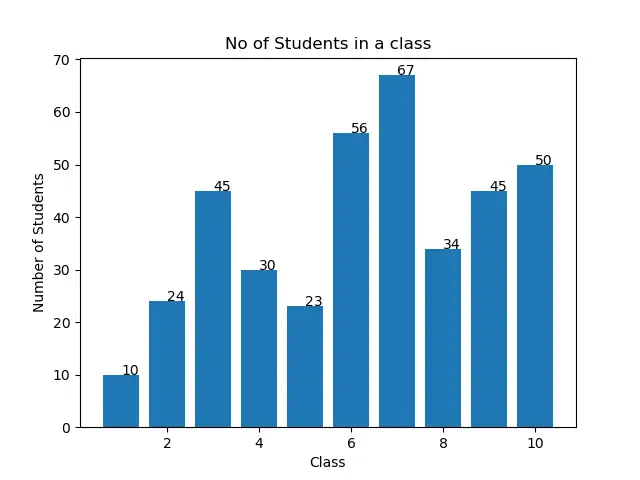
你可能會觀察到值標籤不在輸出條形圖頂部的中心。我們可以通過操作輸入引數來做到這一點,如以下部分所述。
在每個條形圖的中心在 Matplotlib 條形圖上新增值標籤
要在條形圖頂部中心的 Matplotlib 條形圖上新增值標籤,我們將在 pyplot.text() 函式中指定水平對齊方式為 center,如下所示。
import matplotlib.pyplot as plt


def add_value_label(x_list, y_list):
    for i in range(1, len(x_list) + 1):
        plt.text(i, y_list[i - 1], y_list[i - 1], ha="center")


no_of_students = [10, 24, 45, 30, 23, 56, 67, 34, 45, 50]
class_number = [1, 2, 3, 4, 5, 6, 7, 8, 9, 10]
plt.bar(class_number, no_of_students)
add_value_label(class_number, no_of_students)
plt.title("No of Students in a class")
plt.xlabel("Class")
plt.ylabel("Number of Students")
plt.show()
輸出:

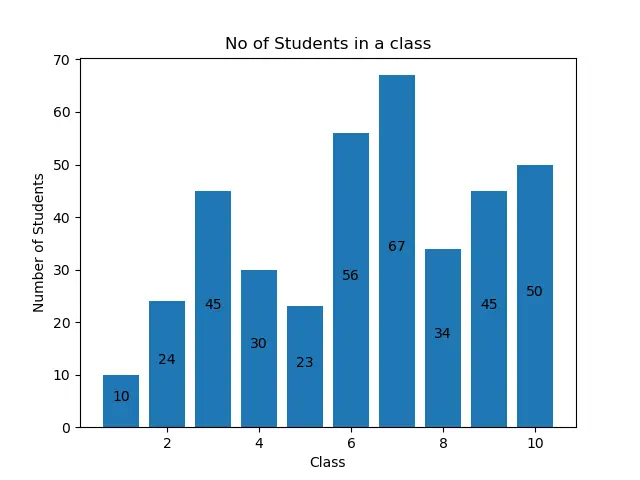
在每個條形高度中間的 Matplotlib 條形圖上新增值標籤
你還可以在每個條形高度的中間新增值標籤。為此,我們必須在 pyplot.text() 函式中將 y 座標指定為 (x 處條形圖的高度)/2。你可以在以下示例程式碼中看到這一點。
import matplotlib.pyplot as plt


def add_value_label(x_list, y_list):
    for i in range(1, len(x_list) + 1):
        plt.text(i, y_list[i - 1] / 2, y_list[i - 1], ha="center")


no_of_students = [10, 24, 45, 30, 23, 56, 67, 34, 45, 50]
class_number = [1, 2, 3, 4, 5, 6, 7, 8, 9, 10]
plt.bar(class_number, no_of_students)
add_value_label(class_number, no_of_students)
plt.title("No of Students in a class")
plt.xlabel("Class")
plt.ylabel("Number of Students")
plt.show()
輸出:

使用 pyplot.annotate() 函式在 Matplotlib 條形圖上新增值標籤
除了 pyplot.text() 函式,我們可以使用 pyplot.annotate() 函式在 matplotlib 條形圖上新增值標籤。pyplot.annotate() 函式的語法如下。
matplotlib.pyplot.annotate(text, xy, *args, **kwargs)
這裡,
- 引數
text是將新增到圖表中的標籤。 - 引數
xy接受一個元組(x,y),其中x和y是將標籤新增到圖形的座標。 - 該函式接受許多不同的引數。本文將僅使用引數
ha來設定條形圖中標籤的水平對齊方式。
我們將使用 pyplot.bar() 函式繪製條形圖。然後,我們將分別使用 title()、xlabel() 和 ylabel() 函式將 title、xlablel 和 ylabel 新增到圖中。
為了在 Matplotlib 條形圖上新增值標籤,我們將定義一個函式 add_value_label(x_list,y_list)。這裡,x 和 y 是包含 x 軸和 y 軸資料的列表。在函式 add_value_label() 中,我們將根據為 x 和 y 座標提供的資料建立的元組作為輸入引數傳遞給引數 xy。有了這個,我們將其他值傳遞給 annotate() 函式,以在 Matplotlib 條形圖上新增值標籤,如下所示。
import matplotlib.pyplot as plt


def add_value_label(x_list, y_list):
    for i in range(1, len(x_list) + 1):
        plt.annotate(y_list[i - 1], (i, y_list[i - 1]))


no_of_students = [10, 24, 45, 30, 23, 56, 67, 34, 45, 50]
class_number = [1, 2, 3, 4, 5, 6, 7, 8, 9, 10]
plt.bar(class_number, no_of_students)
add_value_label(class_number, no_of_students)
plt.title("No of Students in a class")
plt.xlabel("Class")
plt.ylabel("Number of Students")
plt.show()
輸出:

同樣,你可以觀察到標籤未與條形圖對齊。要對齊它們,你可以使用水平對齊引數 ha 設定以下對齊方式。
import matplotlib.pyplot as plt


def add_value_label(x_list, y_list):
    for i in range(1, len(x_list) + 1):
        plt.annotate(y_list[i - 1], (i, y_list[i - 1]), ha="center")


no_of_students = [10, 24, 45, 30, 23, 56, 67, 34, 45, 50]
class_number = [1, 2, 3, 4, 5, 6, 7, 8, 9, 10]
plt.bar(class_number, no_of_students)
add_value_label(class_number, no_of_students)
plt.title("No of Students in a class")
plt.xlabel("Class")
plt.ylabel("Number of Students")
plt.show()
輸出:

你還可以在每個條形高度的中間新增值標籤。為此,我們必須將元組中的 y 座標指定為 (x 處條形圖的高度)/2。你可以在以下示例程式碼中看到這一點。
import matplotlib.pyplot as plt


def add_value_label(x_list, y_list):
    for i in range(1, len(x_list) + 1):
        plt.annotate(y_list[i - 1], (i, y_list[i - 1] / 2), ha="center")


no_of_students = [10, 24, 45, 30, 23, 56, 67, 34, 45, 50]
class_number = [1, 2, 3, 4, 5, 6, 7, 8, 9, 10]
plt.bar(class_number, no_of_students)
add_value_label(class_number, no_of_students)
plt.title("No of Students in a class")
plt.xlabel("Class")
plt.ylabel("Number of Students")
plt.show()
輸出:
まとめ
本文討論了使用 text() 函式和 annotate() 函式在 Matplotlib 條形圖上新增值標籤的兩種方法。我們還看到了如何通過更改引數來決定標籤的對齊方式和位置。你可以根據自己的方便使用任何討論過的方法在 Matplotlib 條形圖上新增值標籤。

Aditya Raj is a highly skilled technical professional with a background in IT and business, holding an Integrated B.Tech (IT) and MBA (IT) from the Indian Institute of Information Technology Allahabad. With a solid foundation in data analytics, programming languages (C, Java, Python), and software environments, Aditya has excelled in various roles. He has significant experience as a Technical Content Writer for Python on multiple platforms and has interned in data analytics at Apollo Clinics. His projects demonstrate a keen interest in cutting-edge technology and problem-solving, showcasing his proficiency in areas like data mining and software development. Aditya's achievements include securing a top position in a project demonstration competition and gaining certifications in Python, SQL, and digital marketing fundamentals.
GitHub