How to Plot Time Series Data in Seaborn
-
Use the
seaborn.lineplot()Function to Plot Time Series Data in Seaborn -
Use the
seaborn.tsplot()Function to Plot Time Series Data in Seaborn -
Use the
seaborn.barplot()Function to Plot Time Series Data in Seaborn
Time-series data is a special type of data where we observe some set of observations over time. The timestamp of every observation is recorded. Such type of data is usually dealt with when we talk about stock prices, sensor data, application monitored data, etc.
In this tutorial, we will learn how to plot such time series data in Python using the Seaborn module.
We will create our own sample time series data for plotting.
Use the seaborn.lineplot() Function to Plot Time Series Data in Seaborn
A line plot is one of the most basic plots of this module. It is generally used to keep track of something with respect to time; that is why it is highly used with time-series data.
In the following code, we plot time-series data using the seaborn.lineplot() function.
import pandas as pd
import matplotlib.pyplot as plt
import seaborn as sns

df = pd.DataFrame(
    {
        "Date": [
            "01/01/2019",
            "01/02/2019",
            "01/03/2019",
            "01/04/2019",
            "01/05/2019",
            "01/06/2019",
            "01/07/2019",
            "01/08/2019",
        ],
        "Price": [77, 76, 68, 70, 78, 79, 74, 75],
    }
)
plt.figure(figsize=(15, 8))
sns.lineplot(x="Date", y="Price", data=df)
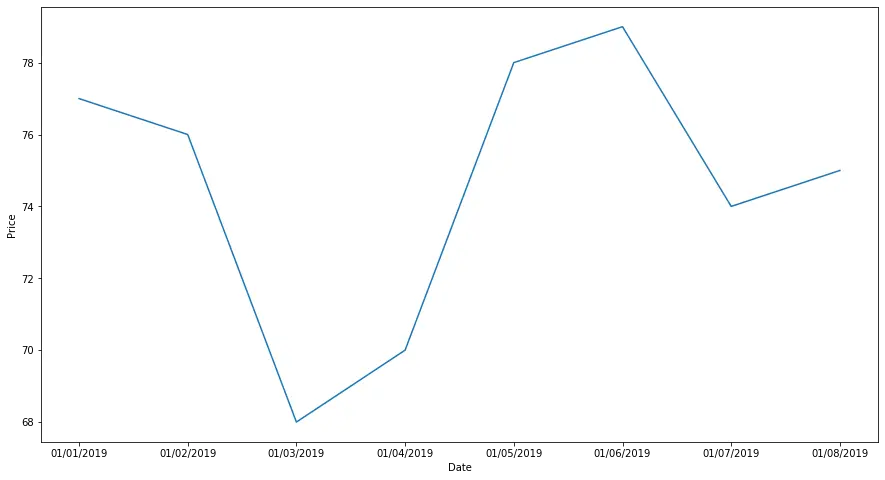
Note that we had to process the DataFrame before using it with the function. We had to ensure that the Date column was of the datetime format, which is done using the pd.to_datetime() function.
The plt.figure() command is used to alter the size of the final figure.
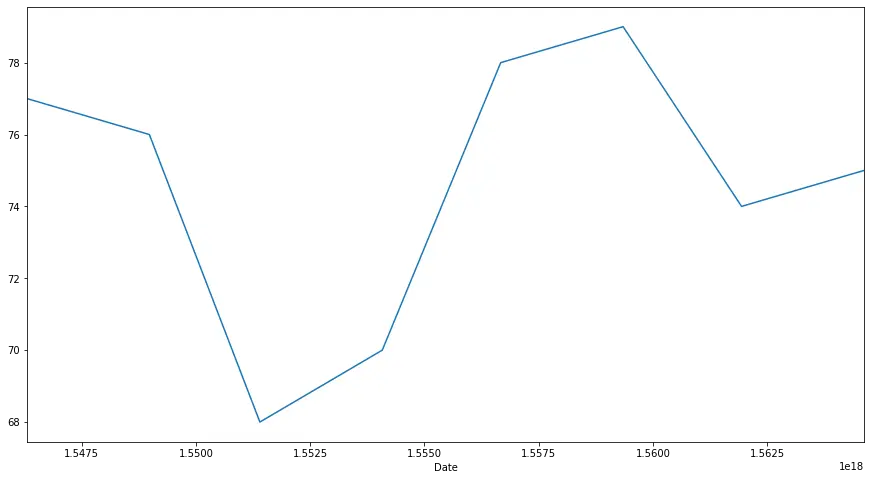
Use the seaborn.tsplot() Function to Plot Time Series Data in Seaborn
The seaborn.tsplot() is a relatively new addition to the recent versions of the module. It is used when we have the timestamp for the data available. It is used to plot one or more time-series data. The data can be either in the form of a long DataFrame or an N-Dimensional array with dimensions in units and time.
The following code shows how to use this function.
import pandas as pd
import matplotlib.pyplot as plt
import seaborn as sns

df = pd.DataFrame(
    {
        "Date": [
            "01012019",
            "01022019",
            "01032019",
            "01042019",
            "01052019",
            "01062019",
            "01072019",
            "01082019",
        ],
        "Price": [77, 76, 68, 70, 78, 79, 74, 75],
    }
)
df["Date"] = pd.to_datetime(df["Date"], format="%d%m%Y")

plt.figure(figsize=(15, 8))
sns.tsplot(data=df["Price"], time=df["Date"])
Use the seaborn.barplot() Function to Plot Time Series Data in Seaborn
A bar plot is used to represent the observed values in rectangular bars. The seaborn module in Python uses the seaborn.barplot() function to create bar plots.
A bar plot can be used to show continuous time-series data.
For example,
import pandas as pd
import matplotlib.pyplot as plt
import seaborn as sns

df = pd.DataFrame(
    {
        "Date": [
            "01012019",
            "01022019",
            "01032019",
            "01042019",
            "01052019",
            "01062019",
            "01072019",
            "01082019",
        ],
        "Price": [77, 76, 68, 70, 78, 79, 74, 75],
    }
)
df["Date"] = pd.to_datetime(df["Date"], format="%d%m%Y")

plt.figure(figsize=(15, 8))
sns.barplot(x="Date", y="Price", data=df)

The previous two methods plotted the data using lines, so this offers an alternative visualization for the time-series data.

Manav is a IT Professional who has a lot of experience as a core developer in many live projects. He is an avid learner who enjoys learning new things and sharing his findings whenever possible.
LinkedIn