R에서 축 레이블 회전
- Base R에서 축 레이블 회전
- 축 레이블을 수평으로 회전
- 축 레이블을 수직으로 회전
- 축에 수직으로 축 레이블 회전
-
ggplot에서 축 레이블 회전 -
ggplot에서 축 레이블을 90도 회전 -
ggplot에서 축 레이블을 45도 회전
Base R과 ggplot에는 R에서 축 레이블을 회전하는 다른 방법이 있습니다. 이 자습서에서는 R에서 축 레이블을 회전하는 방법을 보여줍니다.
Base R에서 축 레이블 회전
기본 R에서 축 레이블을 축에 대해 수평, 수직 또는 수직으로 회전할 수 있습니다. 먼저 레이블을 회전할 플롯을 표시한 후 각 방법을 다음에서 설명합니다.
예제 코드:
# Create example Data
set.seed(99999)
xLabel <- rnorm(1000)
yLabel <- rnorm(1000)
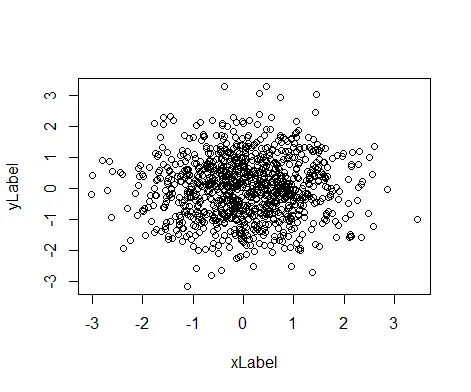
# The Default Plot
plot(xLabel, yLabel)
출력:
축 레이블을 수평으로 회전
플롯에서 las=1을 전달하여 축 레이블을 수평으로 회전할 수 있습니다.
예제 코드:
# Create example Data
set.seed(99999)

xLabel <- rnorm(1000)
yLabel <- rnorm(1000)

# The Horizontal Axis Plot
plot(xLabel, yLabel, las=1)
위의 코드는 가로 축 레이블이 있는 플롯을 만듭니다.
출력:

축 레이블을 수직으로 회전
플롯에서 las=3을 전달하여 축 레이블을 수직으로 회전할 수 있습니다.
예제 코드:
# Create example Data
set.seed(99999)

xLabel <- rnorm(1000)
yLabel <- rnorm(1000)

# The Vertical Axis Plot
plot(xLabel, yLabel, las=3)
위의 코드는 세로 축 레이블이 있는 플롯을 만듭니다.
출력:

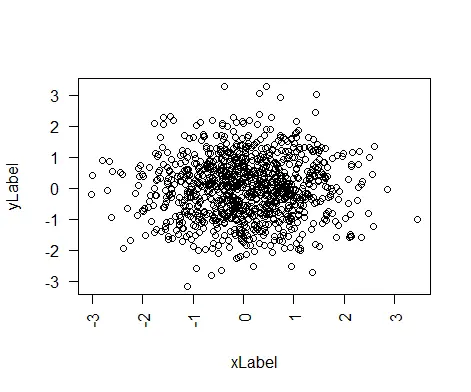
축에 수직으로 축 레이블 회전
플롯에서 las=2를 전달하여 축 레이블을 축에 수직으로 회전할 수 있습니다.
예제 코드:
# Create example Data
set.seed(99999)

xLabel <- rnorm(1000)
yLabel <- rnorm(1000)

# The Perpendicular Axis Plot
plot(xLabel, yLabel, las=2)
위의 코드는 축 레이블에 수직인 플롯을 만듭니다.
출력:
las 값은 Base R의 모든 유형의 플롯에서 변경할 수 있습니다.
ggplot에서 축 레이블 회전
다음 구문을 사용하여 ggplot2에서 축 레이블을 회전할 수 있습니다.
plot + theme(axis.text.x = element_text(angle = 45, vjust = 1, hjust=1))
레이블은 45도 각도로 회전하고 vjust 및 hjust는 레이블 텍스트의 수직 및 수평 정렬을 제어합니다. ggplot2에서 축 레이블을 회전할 수 있는 플롯을 생성해 보겠습니다.
예제 코드:
# Create example Data
Delftstack <- data.frame(Designation=c('CEO', 'Project Manager', 'Senior Dev', 'Junior Dev', 'Intern'),
Id=c(101, 102, 103, 104, 105))
#view the data
Delftstack
#plot the data using gglpot
library(ggplot2)
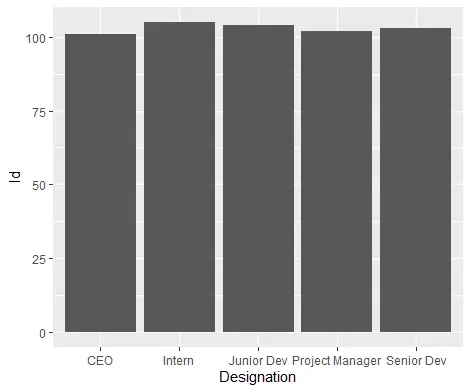
#create bar plot
ggplot(data=Delftstack, aes(x=Designation, y=Id)) +
geom_bar(stat="identity")
위의 코드는 주어진 데이터에서 기본 플롯을 생성합니다.
출력:
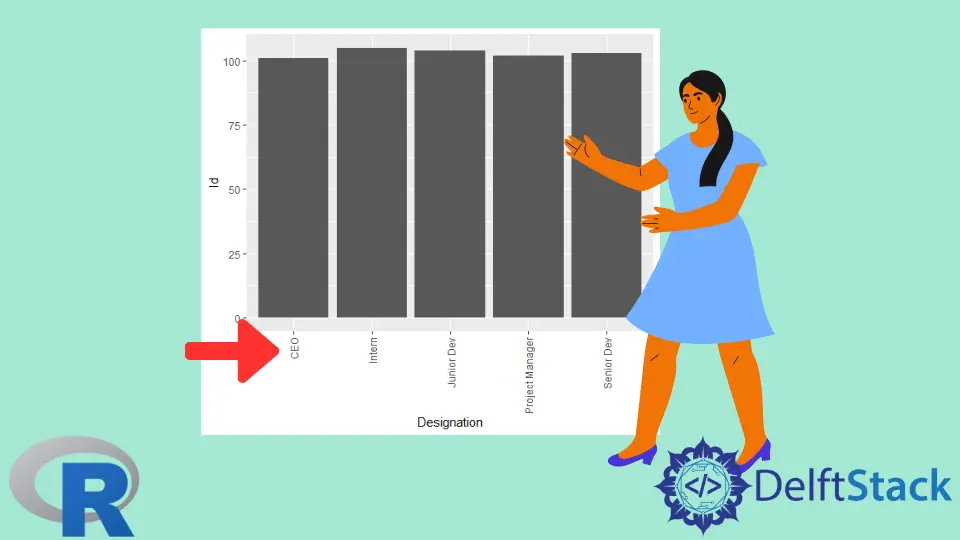
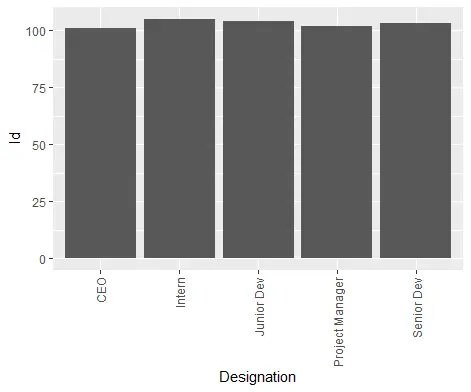
ggplot에서 축 레이블을 90도 회전
ggplot2에서 축 레이블을 90도 회전하는 각도에 90 값을 지정할 수 있습니다.
예제 코드:
# Create example Data
Delftstack <- data.frame(Designation=c('CEO', 'Project Manager', 'Senior Dev', 'Junior Dev', 'Intern'),
                         Id=c(101, 102, 103, 104, 105))

#plot the data using gglpot2
library(ggplot2)

#create bar plot
ggplot(data=Delftstack, aes(x=Designation, y=Id)) +
  geom_bar(stat="identity") +
  theme(axis.text.x = element_text(angle=90, vjust=.5, hjust=1))
위의 코드는 축이 90도로 회전된 gglpot2를 생성합니다.
출력:
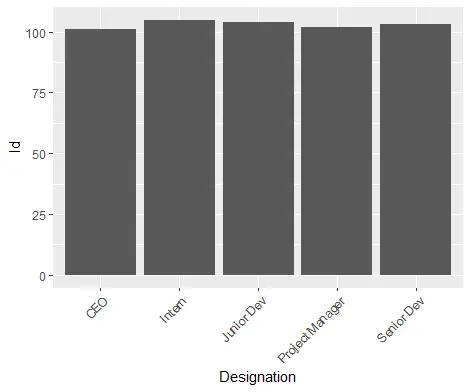
ggplot에서 축 레이블을 45도 회전
ggplot2에서 축 레이블을 45도 회전하는 각도에 45 값을 지정할 수 있습니다.
예제 코드:
# Create example Data
Delftstack <- data.frame(Designation=c('CEO', 'Project Manager', 'Senior Dev', 'Junior Dev', 'Intern'),
                         Id=c(101, 102, 103, 104, 105))

#plot the data using gglpot2
library(ggplot2)

#create bar plot
ggplot(data=Delftstack, aes(x=Designation, y=Id)) +
  geom_bar(stat="identity") +
  theme(axis.text.x = element_text(angle=45, vjust=1, hjust=1))
위의 코드는 축이 45도 회전된 gglpot을 생성합니다.
출력:

Sheeraz is a Doctorate fellow in Computer Science at Northwestern Polytechnical University, Xian, China. He has 7 years of Software Development experience in AI, Web, Database, and Desktop technologies. He writes tutorials in Java, PHP, Python, GoLang, R, etc., to help beginners learn the field of Computer Science.
LinkedIn Facebook