在 R 中旋转轴标签
Base R 和 ggplot 在 R 中旋转轴标签的方式不同。本教程演示如何在 R 中旋转轴标签。
在基础 R 中旋转轴标签
在 base R 中,我们可以水平、垂直或垂直于轴旋转轴标签。让我们首先展示我们将为其旋转标签的图,然后,下面将演示每种方法。
示例代码:
# Create example Data
set.seed(99999)
xLabel <- rnorm(1000)
yLabel <- rnorm(1000)
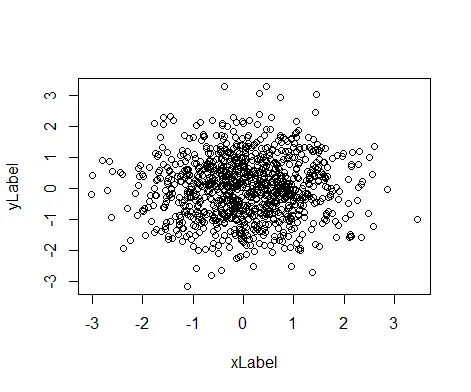
# The Default Plot
plot(xLabel, yLabel)
输出:
水平旋转轴标签
我们可以通过在图中传递 las=1 水平旋转轴标签。
示例代码:
# Create example Data
set.seed(99999)

xLabel <- rnorm(1000)
yLabel <- rnorm(1000)

# The Horizontal Axis Plot
plot(xLabel, yLabel, las=1)
上面的代码创建了一个带有水平轴标签的图。
输出:

垂直旋转轴标签
我们可以通过在图中传递 las=3 来垂直旋转轴标签。
示例代码:
# Create example Data
set.seed(99999)

xLabel <- rnorm(1000)
yLabel <- rnorm(1000)

# The Vertical Axis Plot
plot(xLabel, yLabel, las=3)
上面的代码创建了一个带有垂直轴标签的图。
输出:

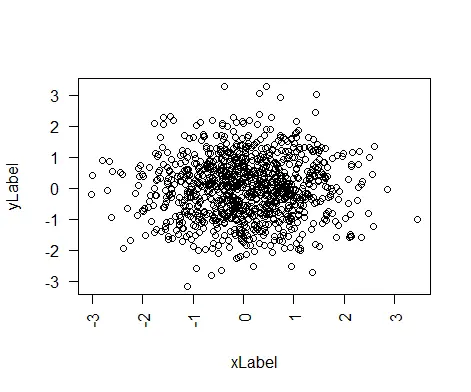
旋转轴标签垂直于轴
我们可以通过在图中传递 las=2 来垂直于轴旋转轴标签。
示例代码:
# Create example Data
set.seed(99999)

xLabel <- rnorm(1000)
yLabel <- rnorm(1000)

# The Perpendicular Axis Plot
plot(xLabel, yLabel, las=2)
上面的代码创建了一个垂直于轴标签的图。
输出:
las 值可以在 Base R 中的任何类型的绘图中更改。
在 ggplot 中旋转轴标签
使用以下语法,我们可以旋转 ggplot2 中的轴标签。
plot + theme(axis.text.x = element_text(angle = 45, vjust = 1, hjust=1))
标签将旋转 45 度角,vjust 和 hjust 将控制标签文本的垂直和水平对齐方式。让我们创建一个绘图,我们可以在 ggplot2 中旋转轴标签。
示例代码:
# Create example Data
Delftstack <- data.frame(Designation=c('CEO', 'Project Manager', 'Senior Dev', 'Junior Dev', 'Intern'),
Id=c(101, 102, 103, 104, 105))
#view the data
Delftstack
#plot the data using gglpot
library(ggplot2)
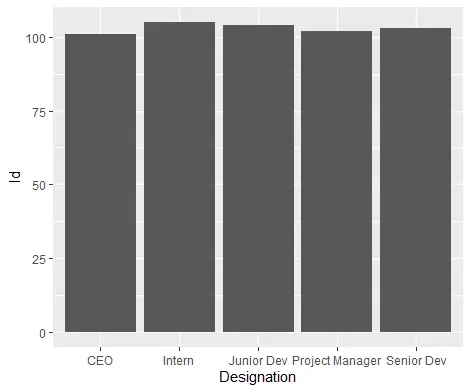
#create bar plot
ggplot(data=Delftstack, aes(x=Designation, y=Id)) +
geom_bar(stat="identity")
上面的代码将从给定的数据创建一个默认图。
输出:
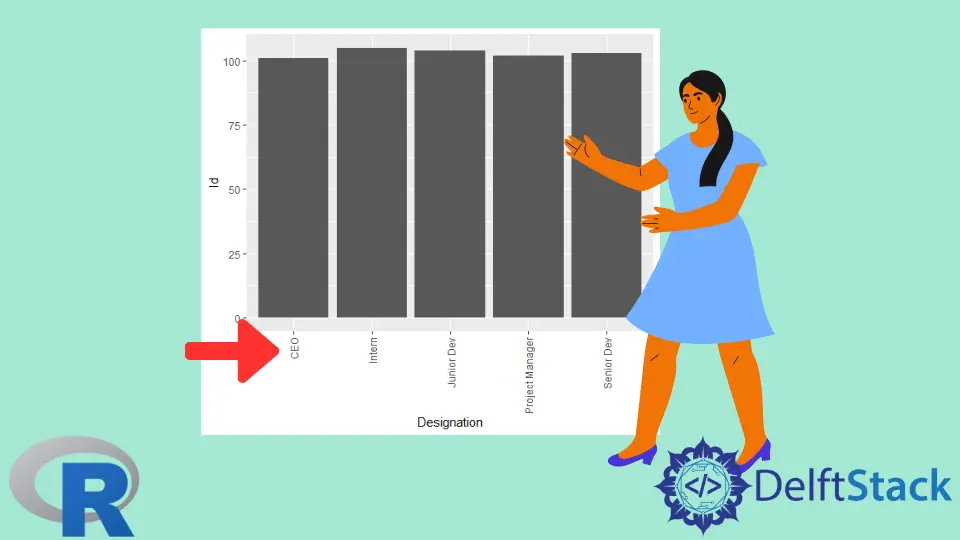
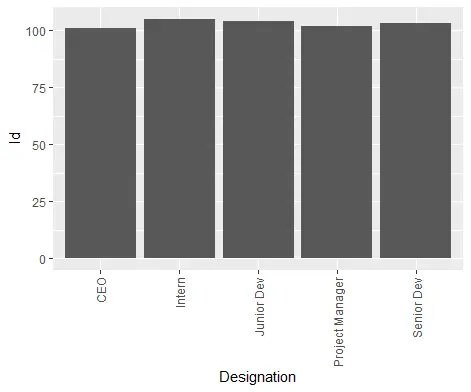
在 ggplot 中将轴标签旋转 90 度
我们可以在 ggplot2 中将值 90 赋予将轴标签旋转 90 度的角度。
示例代码:
# Create example Data
Delftstack <- data.frame(Designation=c('CEO', 'Project Manager', 'Senior Dev', 'Junior Dev', 'Intern'),
                         Id=c(101, 102, 103, 104, 105))

#plot the data using gglpot2
library(ggplot2)

#create bar plot
ggplot(data=Delftstack, aes(x=Designation, y=Id)) +
  geom_bar(stat="identity") +
  theme(axis.text.x = element_text(angle=90, vjust=.5, hjust=1))
上面的代码将创建一个轴旋转 90 度的 gglpot2。
输出:
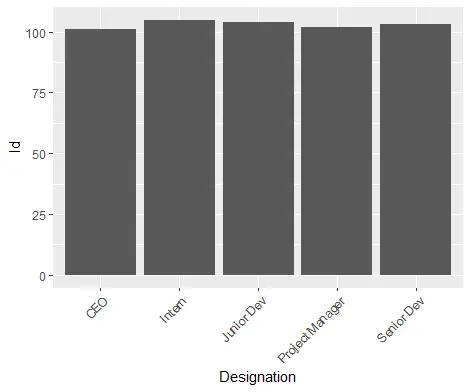
在 ggplot 中将轴标签旋转 45 度
我们可以在 ggplot2 中将值 45 赋予将轴标签旋转 45 度的角度。
示例代码:
# Create example Data
Delftstack <- data.frame(Designation=c('CEO', 'Project Manager', 'Senior Dev', 'Junior Dev', 'Intern'),
                         Id=c(101, 102, 103, 104, 105))

#plot the data using gglpot2
library(ggplot2)

#create bar plot
ggplot(data=Delftstack, aes(x=Designation, y=Id)) +
  geom_bar(stat="identity") +
  theme(axis.text.x = element_text(angle=45, vjust=1, hjust=1))
上面的代码将创建一个轴旋转 45 度的 gglpot。
输出:

Sheeraz is a Doctorate fellow in Computer Science at Northwestern Polytechnical University, Xian, China. He has 7 years of Software Development experience in AI, Web, Database, and Desktop technologies. He writes tutorials in Java, PHP, Python, GoLang, R, etc., to help beginners learn the field of Computer Science.
LinkedIn Facebook