Pandas 산점도 회귀선
- Pandas와 함께 산점도를 사용하여 회귀 그리기
-
regplot()을 사용하여 회귀를 그립니다. -
Implot()을 사용하여 회귀를 그립니다. -
sklearn을 사용하여 회귀선을 산점도와 병합 -
Pandas 산점도 회귀선에
Matplotlib사용 -
seaborn을 사용하여 회귀선 그리기 - 결론
Pandas와 함께 제공되는 차트 작성 도구는 환상적인 도구입니다. Seaborn, Bokeh 및 Plotly와 같은 다양한 플로팅 라이브러리가 있지만 대부분의 요구 사항에 매우 만족스러운 Pandas 플로팅이 있음을 알 수 있습니다.
그러나 이 기사에서는 Python의 Seaborn 라이브러리와 matplotlib 방법을 사용하여 Pandas의 산점도 회귀선을 만드는 방법을 살펴봅니다.
Pandas와 함께 산점도를 사용하여 회귀 그리기
Python에서는 Pandas와 함께 산점도를 사용하여 회귀를 그립니다. 다음 코드를 활용하여 Pandas에서 Scatterplot을 만들 수 있습니다.
df.plot.scatter(x="one", y="two", title="Scatterplot")
매개변수가 있는 경우 회귀선을 플로팅하고 피팅의 매개변수를 표시합니다.
df.plot.scatter(x="one", y="two", title="Scatterplot", Regression_line)
그러나 두 수치 변수의 산점도에 회귀 곡선을 추가하여 선형 추세를 결정할 수 있습니다. 또한 산점도에 회귀 곡선을 추가하여 더 독특하게 만드는 그림도 볼 수 있습니다.
이를 위한 세 가지 핵심 단계가 있습니다.
- 필요한 라이브러리를 가져옵니다.
- 데이터를 생성, 로드 또는 가져옵니다.
regplot()또는lmplot()함수를 사용하여 그래프를 그립니다.
Python 버전에 따라 다음 방법을 사용하여 먼저 이러한 라이브러리의 모듈이 있어야 합니다.
코드 - seaborn:
# in a virtual environment or using Python2
pip install seaborn

# for python3 (could also be pip3.10 depending on your version)
pip3 install seaborn

# if you get a permissions error
sudo pip3 install seaborn

# if you don't have pip in your PATH environment variable
python -m pip install seaborn

# for python3 (could also be pip3.10 depending on your version)
python3 -m pip install seaborn

# alternative for Ubuntu/Debian
sudo apt-get install python3-seaborn

# alternative for CentOS
sudo yum install python3-seaborn

# alternative for Fedora
sudo yum install python3-seaborn

# for Anaconda
conda install -c conda-forge seaborn
코드 - matplotib:
# in a virtual environment or using Python2
pip install matplotlib

# for python3 (could also be pip3.10 depending on your version)
pip3 install matplotlib

# if you get a permissions error
sudo pip3 install matplotlib

# if you don't have pip in your PATH environment variable
python -m pip install matplotlib

# for python3 (could also be pip3.10 depending on your version)
python3 -m pip install matplotlib

# alternative for Ubuntu/Debian
sudo apt-get install python3-matplotlib

# alternative for CentOS
sudo yum install python3-matplotlib

# alternative for Fedora
sudo yum install python3-matplotlib

# for Anaconda
conda install -c conda-forge matplotlib
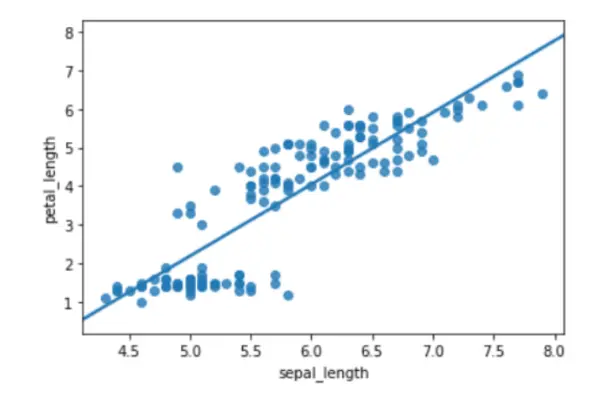
regplot()을 사용하여 회귀를 그립니다.
이 기술은 데이터와 선형 회귀 모델에 대한 적합도를 플로팅합니다. 그러나 회귀 모델을 추정하기 위한 몇 가지 옵션이 있으며 모두 상호 배타적입니다.
코드 예:
# importing libraries
import seaborn as sb

# load data
df = sb.load_dataset("iris")

# use regplot
sb.regplot(x="sepal_length", y="petal_length", ci=None, data=df)
출력:
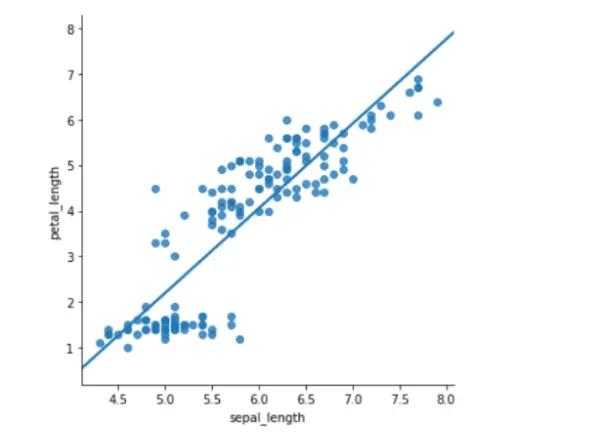
Implot()을 사용하여 회귀를 그립니다.
또 다른 간단한 플롯은 lmplot()입니다. 선형 회귀 모델을 나타내는 선과 2D 공간의 데이터 포인트를 표시합니다.
그러나 x 및 y 레이블을 조정하여 각각 가로 및 세로 축을 나타낼 수 있습니다.
코드 예:
# importing libraries
import seaborn as sb

# load data
df = sb.load_dataset("iris")

# use lmplot
sb.lmplot(x="sepal_length", y="petal_length", ci=None, data=df)
출력:
sklearn을 사용하여 회귀선을 산점도와 병합
코드 예:
from sklearn.model_selection import train_test_split
import numpy as np
import pandas as pd
from matplotlib import pyplot as plt
import seaborn as sns
from sklearn.linear_model import LinearRegression

marks_df = pd.read_csv("student_marks.csv")
marks_df.head()
X = marks_df.iloc[:, :-1].values
y = marks_df.iloc[:, 1].values


X_train, X_test, y_train, y_test = train_test_split(X, y, test_size=0.2, random_state=0)

regressor = LinearRegression()
regressor.fit(X_train, y_train)
y_pred = regressor.predict(X_test)
plt.scatter(X_train, y_train, color="g")

plt.plot(X_test, y_pred, color="k")
plt.show()
출력:

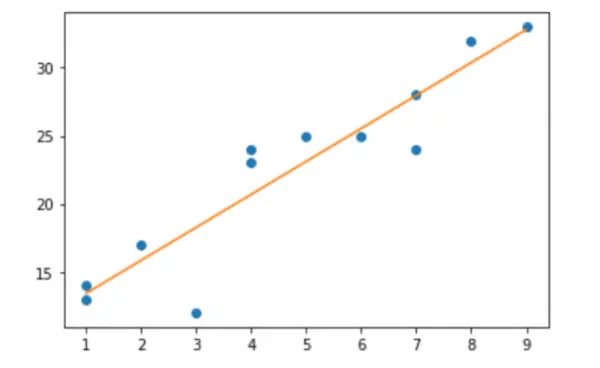
Pandas 산점도 회귀선에 Matplotlib 사용
다음 코드는 Matplotlib를 사용하여 이러한 데이터에 대해 평가된 회귀선이 있는 산점도를 생성하는 방법을 보여줍니다.
코드 예:
# import libraries
import numpy as np
import matplotlib.pyplot as plt

# creating data
a = np.array([1, 3, 1, 5, 0, 9, 5, 7, 6, 7, 3, 7])
b = np.array([13, 18, 17, 12, 23, 14, 27, 25, 24, 23, 36, 31])

# create a simple scatterplot
plt.plot(a, b, "o")

# obtain the m (slope) and b(intercept) of the linear regression line
m, b = np.polyfit(x, y, 1)

# add a linear regression line to the scatterplot
plt.plot(x, m * x + b)
출력:
seaborn을 사용하여 회귀선 그리기
먼저 데이터 세트에 필요한 pandas, random, matplotlib 및 seaborn과 같은 모듈을 가져옵니다.
import pandas as pd
import random
import matplotlib.pyplot as plt
import seaborn as sns
빈 데이터 세트를 만든 후 변수 X와 Y에 배치한 random 함수를 사용하여 임의의 데이터 세트를 생성했습니다. 그러나 데이터 세트의 처음 5개 행은 인쇄 기능을 사용하여 인쇄되었습니다.
df = pd.DataFrame()
df["x"] = random.sample(range(1, 500), 70)
df["y"] = random.sample(range(1, 500), 70)
print(df.head())
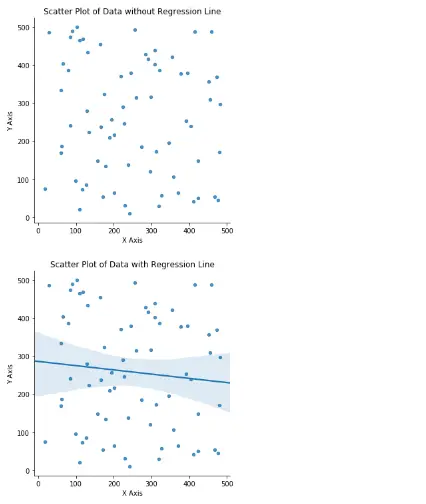
sns.lmplot의 도움으로 먼저 회귀선이 없는 산점도를 그립니다. 그러나 회귀선이 필요하지 않기 때문에 데이터 x, 대상 y, dataframe 및 fit_reg를 False로 입력하고 scatter_kws에 플롯에 대한 숫자를 입력했습니다.
제목, x 및 y축 레이블도 지정되었습니다.
sns.lmplot("x", "y", data=df, fit_reg=False, scatter_kws={"marker": "D", "s": 20})
plt.title("Scatter Plot of Data without Regression Line")
plt.xlabel("X Axis")
plt.ylabel("Y Axis")
plt.show()
회귀선이 있는 산점도를 생성하려면 fir_eg 매개변수를 True로 설정해야 합니다. 그러나 이렇게 하면 산점도 옆에 회귀선이 그려집니다.
제목, x 및 y축 레이블도 지정되었습니다.
sns.lmplot("x", "y", data=df, fit_reg=True, scatter_kws={"marker": "D", "s": 20})

plt.title("Scatter Plot of Data with Regression Line")
plt.xlabel("X Axis")
plt.ylabel("Y Axis")
plt.show()
출력:
     x    y
0   79  386
1  412   42
2  239  139
3  129  279
4  404  239
결론
이것은 Matplotlib 또는 Seaborn을 사용하여 pandas 산점도 회귀선을 만드는 방법입니다. 선형 추세는 두 수치 변수 사이의 산점도에 회귀선을 추가하여 쉽게 볼 수 있습니다.
이 기사에서는 회귀선을 사용하여 산점도를 만드는 두 가지 Python Seaborn 방법을 배웠습니다. 산점도에 회귀선을 추가하는 방법에 대한 그림도 배웠습니다.

Zeeshan is a detail oriented software engineer that helps companies and individuals make their lives and easier with software solutions.
LinkedIn