HOWTO · Seaborn
Seaborn プロットに軸ラベルを追加する
このチュートリアルでは、Python で Seaborn のプロットに軸ラベルを追加する方法を示します。
このチュートリアルでは、Python で Seaborn のプロットに x 軸と y 軸のラベルを追加する方法について説明します。
デフォルトでは、プロット関数で x 軸と y 軸の値を指定すると、グラフはこれらの値を両方の軸のラベルとして使用します。目的の軸ラベルを明示的に追加する他の方法について説明します。
set_xlabel() および set_ylabel() 関数を使用して、Seaborn プロットの軸ラベルを設定する
seaborn プロットは、matplotlibaxes インスタンスタイプオブジェクトを返します。set_xlabel() と set_ylabel を使用して、それぞれ x 軸と y 軸のラベルを設定できます。
例えば、
import pandas as pd
import matplotlib.pyplot as plt
import seaborn as sns

df = pd.DataFrame(
    {"Day 1": [7, 1, 5, 6, 3, 10, 5, 8], "Day 2": [1, 2, 8, 4, 3, 9, 5, 2]}
)

p = sns.lineplot(data=df)
p.set_xlabel("X-Axis", fontsize=20)
p.set_ylabel("Y-Axis", fontsize=20)
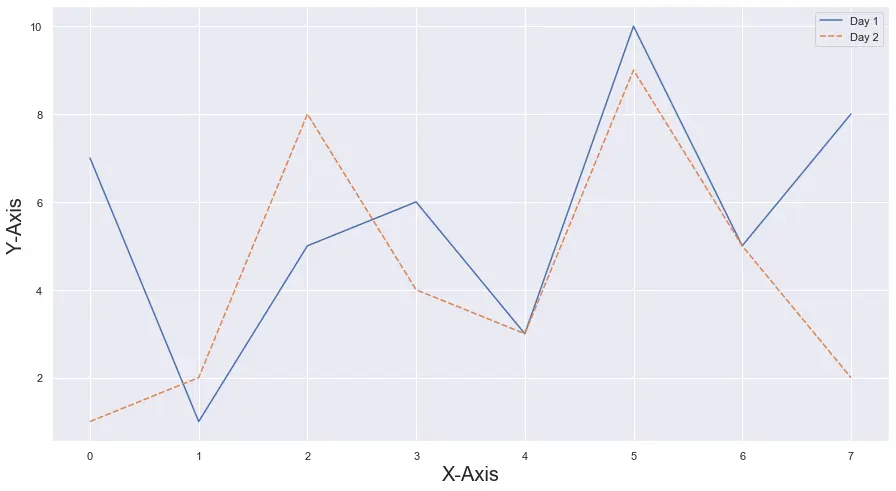
fontsize パラメータを使用して、フォントのサイズを制御できます。
set() 関数を使用して、Seaborn プロットの軸ラベルを設定する
set() 関数は、プロットにさまざまな要素を追加するために使用され、軸ラベルを追加するために使用できます。ラベルを指定するには、xlabel および ylabel パラメーターを使用します。
例えば、
import pandas as pd
import matplotlib.pyplot as plt
import seaborn as sns

df = pd.DataFrame(
    {"Day 1": [7, 1, 5, 6, 3, 10, 5, 8], "Day 2": [1, 2, 8, 4, 3, 9, 5, 2]}
)

p = sns.lineplot(data=df)
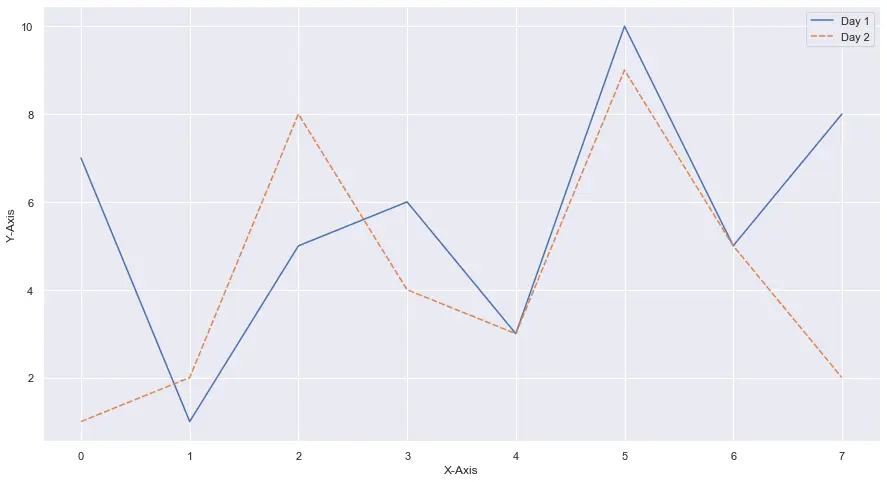
p.set(xlabel="X-Axis", ylabel="Y-Axis")
matplotlib.pyplot.xlabel() および matplotlib.pyplot.ylabel() 関数を使用して、Seaborn プロットの軸ラベルを設定する
これらの関数は、現在のプロットの両方の軸のラベルを設定するために使用されます。size、fontweight、fontsize などのさまざまな引数を使用して、ラベルのサイズと形状を変更できます。
次のコードは、それらの使用法を示しています。
import pandas as pd
import matplotlib.pyplot as plt
import seaborn as sns

df = pd.DataFrame(
    {"Day 1": [7, 1, 5, 6, 3, 10, 5, 8], "Day 2": [1, 2, 8, 4, 3, 9, 5, 2]}
)

p = sns.lineplot(data=df)
plt.xlabel("X-Axis")
plt.ylabel("Y-Axis")