HOWTO · R
pch in R
このチュートリアルでは、R での pch の使用方法を示します。
このページの内容
このチュートリアルでは、R での pch の使用について説明します。
Rのpch
plot character と省略される pch は、さまざまな R 関数でプロットされる文字を設定するために使用される標準の引数です。 pch は、プロットに追加される説明記号として定義することもできます。 この説明テキストには、凡例、軸ラベル、またはタイトルが含まれます。
pch は、特定のことを説明するプロットに追加する記号です。 以下は、pch シンボルとその値のリストです。
pch = 0 square
pch = 1 circle
pch = 2 point up triangle
pch = 3 plus
pch = 4 cross
pch = 5 diamond
pch = 6 point-down triangle
pch = 7 square cross
pch = 8 star
pch = 9 diamond plus
pch = 10 circle plus
pch = 11 up and down triangles
pch = 12 square plus
pch = 13 circle cross
pch = 14 square and down triangle
pch = 15 filled square
pch = 16 filled circle
pch = 17 point-up filled triangle
pch = 18 filled diamond
pch = 19 solid circle
pch = 20 bullet (smaller circle)
pch = 21 filled circle blue
pch = 22 filled square blue
pch = 23 filled diamond blue
pch = 24 filled triangle point-up blue
pch = 25 filled triangle point down blue
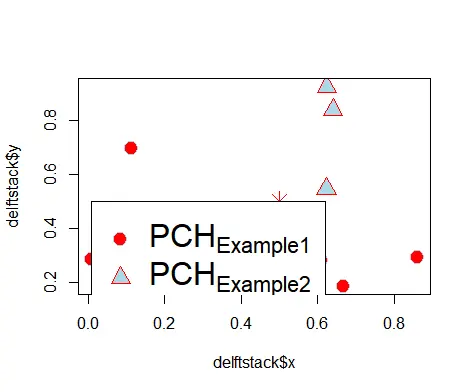
pch は引数として凡例に渡されます。 pch メソッドには、上記のリストの値が含まれます。 pch の例を試してみましょう。
#data
set.seed(1234)
delftstack <- data.frame(x=runif(10),y=runif(10),
                 color=rep(c("lightblue","red"),5),
                 background=rep(c("red", "lightblue"),5),
                 shape=rep(c(21,24),5),stringsAsFactors = FALSE)

#plot
plot(delftstack$x,delftstack$y,col=delftstack$color,bg=delftstack$background,pch=delftstack$shape,cex=2)
points(x=0.5,y=0.5,pch=8,col="red",cex=2)

#add a legend, pt.bg is needed to fill in the background of the shape
legend(0.01,0.5,
       legend = c(expression("PCH"["Example1"]),
                  expression("PCH"["Example2"]),
                  expression("PCH"["Example"])),
       pch = c(21,24,8),
       col = c("lightblue","red","red"),
       pt.bg = c("red","lightblue"),
       cex=2)
上記のコードは、データ フレームからデータをプロットし、凡例では、pch も含むいくつかの特性を適用しようとします。 出力を参照してください。