PC in R
Dieses Tutorial demonstriert die Verwendung von pch in R.
pch in R
Das pch, abgekürzt als plot character, ist das Standardargument, mit dem das Zeichen gesetzt wird, das in verschiedenen R-Funktionen geplottet wird. Das pch kann auch als erklärendes Symbol definiert werden, das einem Diagramm hinzugefügt wird; dieser erläuternde Text enthält Legenden, Achsenbeschriftungen oder Titel.
Die pch sind die Symbole, die Sie einer Handlung hinzufügen möchten, die eine bestimmte Sache erklärt. Hier ist die Liste der pch-Symbole mit ihren Werten.
pch = 0 square
pch = 1 circle
pch = 2 point up triangle
pch = 3 plus
pch = 4 cross
pch = 5 diamond
pch = 6 point-down triangle
pch = 7 square cross
pch = 8 star
pch = 9 diamond plus
pch = 10 circle plus
pch = 11 up and down triangles
pch = 12 square plus
pch = 13 circle cross
pch = 14 square and down triangle
pch = 15 filled square
pch = 16 filled circle
pch = 17 point-up filled triangle
pch = 18 filled diamond
pch = 19 solid circle
pch = 20 bullet (smaller circle)
pch = 21 filled circle blue
pch = 22 filled square blue
pch = 23 filled diamond blue
pch = 24 filled triangle point-up blue
pch = 25 filled triangle point down blue
Das pch wird als Argument an die Legende übergeben; Die Methode pch enthält den Wert aus der obigen Liste. Versuchen wir ein Beispiel für das pch.
#data
set.seed(1234)
delftstack <- data.frame(x=runif(10),y=runif(10),
                 color=rep(c("lightblue","red"),5),
                 background=rep(c("red", "lightblue"),5),
                 shape=rep(c(21,24),5),stringsAsFactors = FALSE)

#plot
plot(delftstack$x,delftstack$y,col=delftstack$color,bg=delftstack$background,pch=delftstack$shape,cex=2)
points(x=0.5,y=0.5,pch=8,col="red",cex=2)

#add a legend, pt.bg is needed to fill in the background of the shape
legend(0.01,0.5,
       legend = c(expression("PCH"["Example1"]),
                  expression("PCH"["Example2"]),
                  expression("PCH"["Example"])),
       pch = c(21,24,8),
       col = c("lightblue","red","red"),
       pt.bg = c("red","lightblue"),
       cex=2)
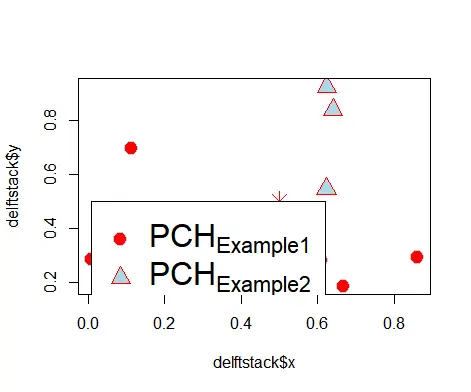
Der obige Code zeichnet die Daten aus dem Datenrahmen und versucht dann in der Legende, einige Merkmale anzuwenden, die auch pch enthalten. Siehe die Ausgabe:

Sheeraz is a Doctorate fellow in Computer Science at Northwestern Polytechnical University, Xian, China. He has 7 years of Software Development experience in AI, Web, Database, and Desktop technologies. He writes tutorials in Java, PHP, Python, GoLang, R, etc., to help beginners learn the field of Computer Science.
LinkedIn Facebook