Pandas でデータポイントで折れ線グラフをプロットする

Pandas は、Python のオープンソースデータ分析ライブラリです。数値データに対して操作を実行するための多くの組み込みメソッドを提供します。
データの視覚化は、ビジュアルを通じてデータをすばやく分析するために、今日非常に人気があります。Matplotlib と呼ばれるライブラリを介して、Pandas データフレームのデータを視覚化できます。
データをプロットするためのさまざまな種類のグラフを提供します。
パンダのデータポイントを使用して単一の折れ線グラフをプロットする
折れ線グラフは、マーカーと呼ばれる一連のデータポイントを直線で結んだグラフです。これは、時間の経過に伴うデータポイントまたは傾向の変化を表します。
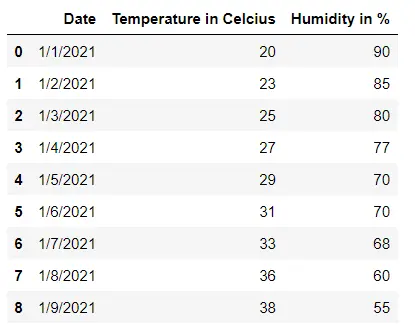
次の例では、気象データがあります。日付と気温の関係をプロットするには、まず、list() メソッドを使用して必要な列をリストに変換する必要があります。
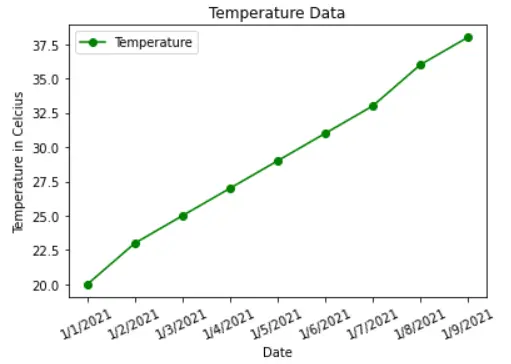
plot() を使用すると、x と y を指定して線グラフをプロットできます。
線 color、linestyle、marker、および label を指定することにより、グラフをさらに装飾することができます。また、xlabel() メソッドと ylabel() メソッドを使用して、両方の軸にタイトルを付けました。
x ラベルを回転させるために、xticks() メソッドを使用しました。legend() は、わかりやすくするために、グラフの隅に色付きの線ラベルを表示します。
最後に、show() メソッドを呼び出して線グラフを表示し、日付と気温の関係を示します。
コード例:
# Python 3.x
import matplotlib.pyplot as plt
import pandas as pd

df = pd.read_csv("weather_data.csv")
display(df)
date = df["Date"]
temp = df["Temperature in Celcius"]
x = list(date)
y = list(temp)
plt.plot(x, y, color="g", linestyle="solid", marker="o", label="Temperature")
plt.xlabel("Date")
plt.xticks(rotation=25)
plt.ylabel("Temperature in Celcius")
plt.title("Temperature Data")
plt.legend()
plt.show()
出力:
パンダのデータポイントで複数の折れ線グラフをプロットする
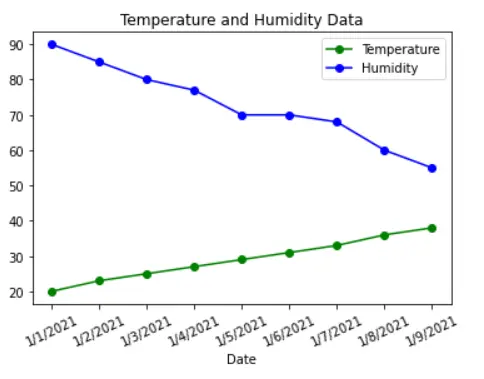
Pandas データフレームの複数の属性をグラフで視覚化するとします。その場合、それぞれが 1 本の線に対して多くの線図を作成する必要があります。
各行には、異なる色とラベルがあります。次の例では、各日付の温度と湿度の両方の折れ線グラフを示しています。
ここで、凡例は、温度と湿度を表す線を区別するのに役立ちます。
コード例:
# Python 3.x
import matplotlib.pyplot as plt
import pandas as pd

df = pd.read_csv("weather_data.csv")
display(df)
date = df["Date"]
temp = df["Temperature in Celcius"]
humidity = df["Humidity in %"]
x = list(date)
y1 = list(temp)
y2 = list(humidity)
plt.plot(x, y1, color="g", linestyle="solid", marker="o", label="Temperature")
plt.plot(x, y2, color="b", linestyle="solid", marker="o", label="Humidity")
plt.xlabel("Date")
plt.xticks(rotation=25)
plt.title("Temperature and Humidity Data")
plt.legend()
plt.show()
出力:

I am Fariba Laiq from Pakistan. An android app developer, technical content writer, and coding instructor. Writing has always been one of my passions. I love to learn, implement and convey my knowledge to others.
LinkedIn