How to Change Seaborn Plot Size
-
Set a Seaborn Chart Figure Size in Python Using the
seaborn.set()Function -
Set a Seaborn Chart Figure Size in Python Using the
rcParamsFunction -
Set Seaborn Chart Figure Size in Python Using the
matplotlib.pyplot.figure()Function -
Set Seaborn Chart Figure Size in Python Using the
matplotlib.pyplot.gcf()Function -
Set Seaborn Chart Figure Size in Python Using
heightandaspectParameters -
Set Seaborn Chart Figure Size in Python Using the
matplotlib.pyplot.subplots()Function - Conclusion

In data science and visualization, creating informative and visually appealing charts is crucial. One powerful tool for crafting aesthetically pleasing plots is Seaborn, a Python data visualization library built on top of Matplotlib.
In this article, we will explore various methods for setting Seaborn chart figure sizes in Python, ranging from using built-in parameters like height and aspect to Matplotlib’s functions like figure(), gcf(), and subplots().
Set a Seaborn Chart Figure Size in Python Using the seaborn.set() Function
The first method we will use is the seaborn.set() function, which allows users to customize various aspects of the library’s appearance, including themes and configurations. For our purpose, we will focus on using it to control the size of Seaborn plots.
Syntax:
import seaborn as sns

sns.set(rc={"figure.figsize": (width, height)})
The rc parameter accepts a dictionary where we specify the keyword argument 'figure.figsize' and the corresponding value as a tuple containing the desired width and height of the figure. Replace width and height with the specific size of the figure.
Set a Seaborn Figure Size Using seaborn.set() Example
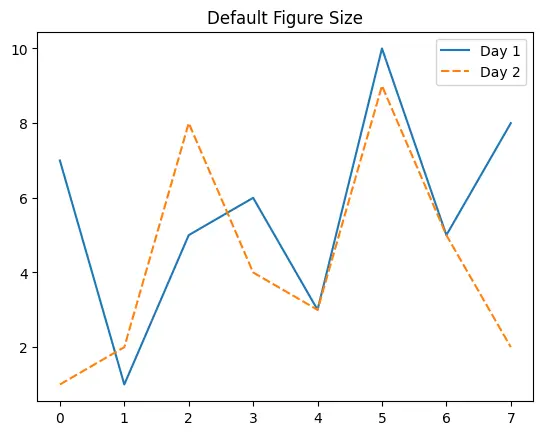
Default Figure Size:
import pandas as pd
import seaborn as sns
import matplotlib.pyplot as plt

# Sample data
df = pd.DataFrame(
    {"Day 1": [7, 1, 5, 6, 3, 10, 5, 8], "Day 2": [1, 2, 8, 4, 3, 9, 5, 2]}
)

sns.lineplot(data=df)
plt.title("Default Figure Size")
plt.show()
In the initial code block, we import the necessary libraries, create sample data, and generate a plot without explicitly setting the figure size. This represents the default behavior.
Code Output:
After Setting Seaborn Figure Size:
import pandas as pd
import seaborn as sns
import matplotlib.pyplot as plt

df = pd.DataFrame(
    {"Day 1": [7, 1, 5, 6, 3, 10, 5, 8], "Day 2": [1, 2, 8, 4, 3, 9, 5, 2]}
)

sns.set(rc={"figure.figsize": (15, 8)})
p = sns.lineplot(data=df)
plt.show()
In this modified code block, we introduce the sns.set(rc={"figure.figsize": (15, 8)}), where we invoke the seaborn.set() function to specify the Seaborn figure size. The rc parameter takes a dictionary, and in this case, we set the keyword argument "figure.figsize" to the desired dimensions of 15 inches in width and 8 inches in height.
Code Output:

The output shows a line plot with the specified figure size of 15 inches by 8 inches, ensuring that the visual representation meets the desired size.
Set a Seaborn Chart Figure Size in Python Using the rcParams Function
In addition to the seaborn.set() function, another approach to setting the Seaborn figure size involves using the rcParams function from the matplotlib.pyplot module. This second method also provides flexibility in customizing the style of the plot.
The rcParams function is used to configure various aspects of Matplotlib’s behavior, including figure size. To change the figure size, we specifically target the "figure.figsize" parameter within rcParams, assigning the desired dimensions as a tuple.
Syntax:
from matplotlib import rcParams

rcParams["figure.figsize"] = (width, height)
Replace width and height with the specific dimensions you want for the figure.
Set a Seaborn Figure Size Using rcParams Example
from matplotlib import rcParams
import pandas as pd
import seaborn as sns
import matplotlib.pyplot as plt

df = pd.DataFrame(
    {"Day 1": [7, 1, 5, 6, 3, 10, 5, 8], "Day 2": [1, 2, 8, 4, 3, 9, 5, 2]}
)

rcParams["figure.figsize"] = 15, 8

p = sns.lineplot(data=df)
plt.show()
To set the figure size, we employ rcParams["figure.figsize"] = 15, 8. This line of code directly modifies the Matplotlib runtime configuration parameters to specify the desired size of 15 inches in width and 8 inches in height.
Code Output:

Set Seaborn Chart Figure Size in Python Using the matplotlib.pyplot.figure() Function
Another straightforward method at our disposal is the matplotlib.pyplot.figure() function, which is used to create a new figure instance. By utilizing the parameter called figsize within this function, we can specify the width and height of the figure object in inches.
Syntax:
import matplotlib.pyplot as plt

plt.figure(figsize=(width, height))
Replace width and height with the specific dimensions you want for the figure. This function must be called before you create your plot to ensure that the figure size is appropriately configured.
Set a Seaborn Figure Size Using matplotlib.pyplot.figure() Example
import pandas as pd
import matplotlib.pyplot as plt
import seaborn as sns

df = pd.DataFrame(
    {"Day 1": [7, 1, 5, 6, 3, 10, 5, 8], "Day 2": [1, 2, 8, 4, 3, 9, 5, 2]}
)

# Set the size of the figure using matplotlib.pyplot.figure()
plt.figure(figsize=(15, 8))

# Create plot
p = sns.lineplot(data=df)
plt.show()
In this example, we use plt.figure(figsize=(15, 8)), where figsize is specified as a tuple representing the width and height of the figure. This method ensures that the subsequent plot adheres to the specified dimensions.
Code Output:

We have successfully created a line plot with the designated Seaborn figure size of 15 inches by 8 inches.
Set Seaborn Chart Figure Size in Python Using the matplotlib.pyplot.gcf() Function
For fine-grained control over the size of plots, the matplotlib.pyplot.gcf() function, in conjunction with set_size_inches(), provides a versatile solution.
The matplotlib.pyplot.gcf() function stands for “get current figure,” and it retrieves the current figure instance. Paired with set_size_inches(), it allows you to adjust the figure size dynamically.
Syntax:
import matplotlib.pyplot as plt

current_fig = plt.gcf()

current_fig.set_size_inches(width, height)
Replace width and height with your desired dimensions. This function is particularly handy when you’ve already created a plot and you want to modify its size.
Set a Seaborn Figure Size Using matplotlib.pyplot.gcf() Example
import pandas as pd
import seaborn as sns
import matplotlib.pyplot as plt

df = pd.DataFrame(
    {"Day 1": [7, 1, 5, 6, 3, 10, 5, 8], "Day 2": [1, 2, 8, 4, 3, 9, 5, 2]}
)

p = sns.lineplot(data=df)

plt.gcf().set_size_inches(15, 8)
plt.show()
Unlike the previous examples, we set the figure size after creating the plot using plt.gcf().set_size_inches(15, 8). The plt.gcf() retrieves the current figure instance, and set_size_inches() is then applied to dynamically adjust the figure to 15 inches in width and 8 inches in height.
Code Output:

As you can see, the output shows a line plot with the specified figure size of 15 inches by 8 inches.
Set Seaborn Chart Figure Size in Python Using height and aspect Parameters
Seaborn simplifies the process of adjusting figure size by offering built-in parameters like height and aspect for specific plot types such as lmplot, catplot, and jointplot. These allow users to directly control the size of the plotted figure without additional function calls.
The height parameter in Seaborn represents the height of the entire figure, while the aspect parameter controls the aspect ratio of the plot.
Set a Seaborn Figure Size Using height and aspect Parameters Example
import pandas as pd
import matplotlib.pyplot as plt
import seaborn as sns

df = pd.DataFrame(
    {"Day 1": [7, 1, 5, 6, 3, 10, 5, 8], "Day 2": [1, 2, 8, 4, 3, 9, 5, 2]}
)

# create plot
p = sns.catplot(data=df, height=8, aspect=15 / 8, kind="bar")
plt.show()
In this example, to set the figure size, we use the sns.catplot() function, which inherently supports the height and aspect parameters. In this case, height=8 sets the figure height to 8 inches, and aspect=15 / 8 controls the ratio to achieve a width of 15 inches.
Code Output:
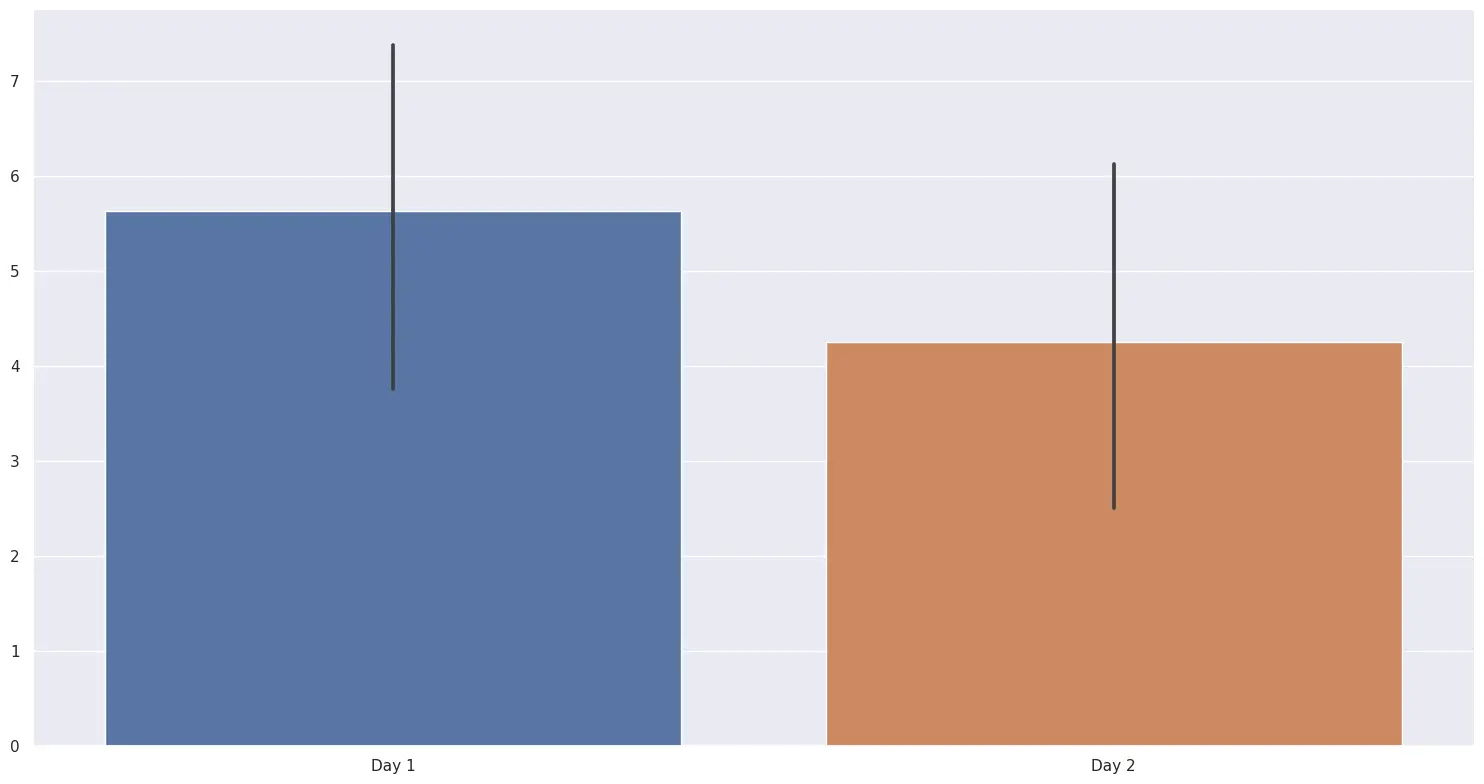
This method is particularly convenient when working with Seaborn plot types that come with built-in parameters.
Set Seaborn Chart Figure Size in Python Using the matplotlib.pyplot.subplots() Function
The matplotlib.pyplot.subplots() function provides a versatile approach to setting figure size in Seaborn plots. By creating figure and axes objects using this function, we can easily customize the dimensions before generating plots.
The matplotlib.pyplot.subplots() function is used to create a figure and a set of subplots. The figsize parameter within this function allows us to specify the width and height of the entire figure in inches, and the individual subplots can be accessed through the Seaborn axes object and assigned specific plots.
This method is particularly useful when multiple subplots are involved, as it provides fine-grained control over the overall figure size.
Set a Seaborn Figure Size Using matplotlib.pyplot.subplots() Example
import pandas as pd
import matplotlib.pyplot as plt
import seaborn as sns

df = pd.DataFrame(
    {"Day 1": [7, 1, 5, 6, 3, 10, 5, 8], "Day 2": [1, 2, 8, 4, 3, 9, 5, 2]}
)

fig, ax = plt.subplots(figsize=(15, 8))

p = sns.lineplot(data=df, ax=ax)
plt.show()
In this example, the key step involves using plt.subplots(figsize=(15, 8)) to create a figure and axes with a specified size of 15 inches by 8 inches. While plotting the Seaborn figure, we set the ax parameter equal to the array of axes that was returned by matplotlib.pyplot.subplots().
Code Output:
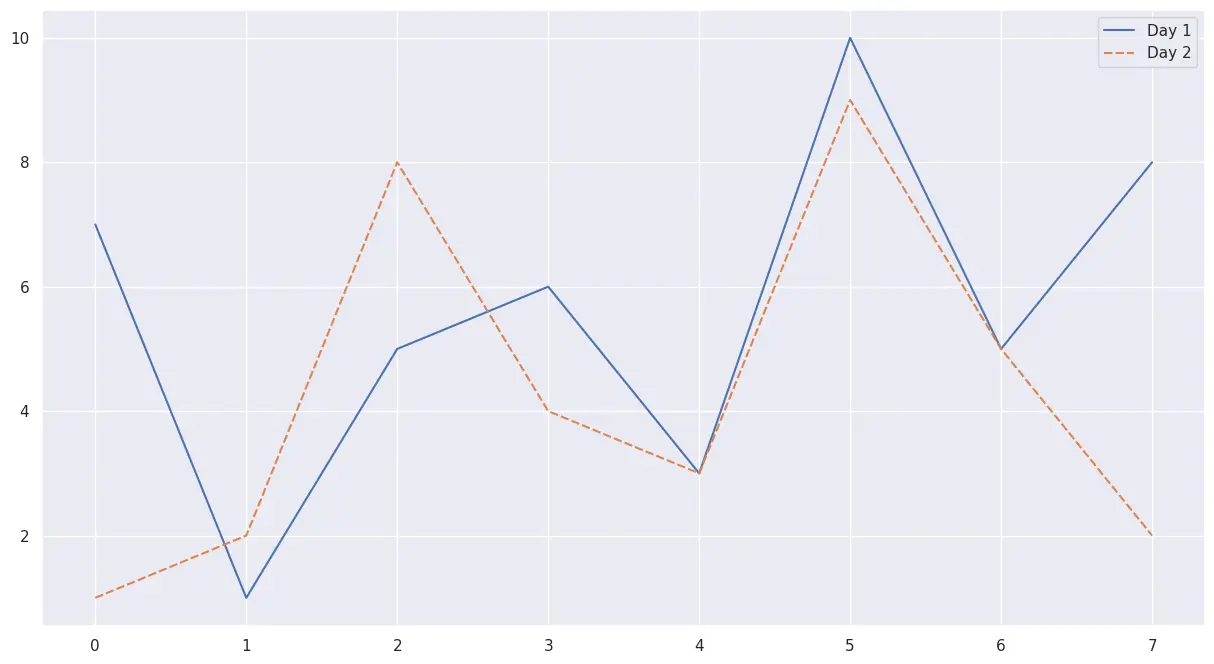
This successfully generated a line plot with the specified Seaborn figure plot size of 15 inches by 8 inches.
Conclusion
This article has provided a comprehensive exploration of various methods, along with some examples, to set Seaborn chart figure sizes in Python. Whether utilizing Seaborn’s built-in parameters like height and aspect, the matplotlib.pyplot.figure() function, the matplotlib.pyplot.gcf() function, or matplotlib.pyplot.subplots(), each method offers a unique approach to tailor the visual representation of your plots.
Mastering these techniques enhances your ability to communicate complex information through visually impactful Seaborn visualizations, a cornerstone in data science.
As a next step, exploring advanced statistical visualizations could be an exciting avenue. Specifically, delving into the topic of Seaborn Heatmaps for Correlation Analysis could enhance your data visualization skills.

Manav is a IT Professional who has a lot of experience as a core developer in many live projects. He is an avid learner who enjoys learning new things and sharing his findings whenever possible.
LinkedIn