How to Create Violin Plot Using Seaborn

The violinplot() function creates such a graph and depicts the distribution like a combination between kernel density graph and a boxplot. It is heavily used by analytics and statisticians to understand the distribution of categorical data. Its main advantage over the traditional boxplots is that they can be used for distributions with multiple peaks also.
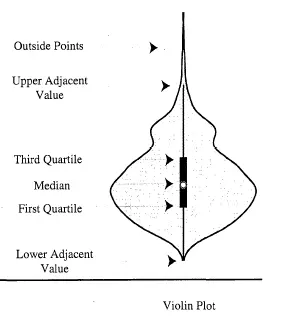
The violin figure in the plot can be a little difficult to understand, but it can depict different statistical values. The following figure will explain this.
Apart from DataFrames, the violinplot() function can work with a single series object, numpy array, or a list vector.
In the following example, we will plot the violin plot distribution of a single variable.
import random
import numpy as np

n = random.sample(range(0, 50), 30)
arr = np.array(n)
sns.violinplot(n)
Note that the sample size has a huge impact on the final figure in the violin plot. The plot can be misleading for a small sample size. If this is still a little confusing, one can plot a simple scatter plot over the violin plot to get a better understanding.
For example,
import random
import numpy as np

n = random.sample(range(0, 50), 30)
arr = np.array(n)
sns.violinplot(n)
sns.stripplot(n, color="red")
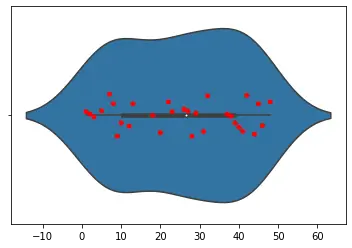
The stripplot() function here plots a scatter plot over the violin plot. Similarly, you can also plot a box plot over the violin plot to understand the similarity and differences between both of them.
The violinplot() main use lies with datasets, showing distributions of data with multiple categories. In the below code, we will implement this.
import pandas as pd
import matplotlib.pyplot as plt
import seaborn as sns

df = pd.DataFrame(
    {
        "Quantity": [5, 6, 7, 8, 5, 6, 7, 8, 5, 6, 7, 8, 5, 6, 7, 8],
        "Price": [9, 10, 15, 16, 13, 14, 15, 18, 11, 12, 14, 15, 16, 17, 18, 19],
        "Day": [1, 1, 1, 1, 1, 1, 1, 1, 2, 2, 2, 2, 2, 2, 2, 2],
        "Product": [
            "A",
            "A",
            "A",
            "A",
            "B",
            "B",
            "B",
            "B",
            "A",
            "A",
            "A",
            "A",
            "B",
            "B",
            "B",
            "B",
        ],
    }
)

sns.violinplot(data=df, y="Price", x="Quantity", hue="Product")
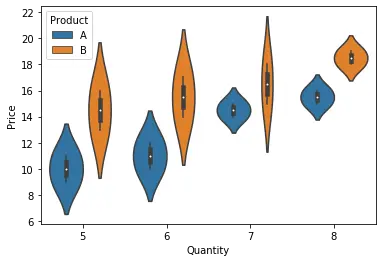
Notice how we were able to efficiently plot the distributions of the price of two different products at different quantities on two days. Notice the use of the hue parameter to plot two products with different colors.
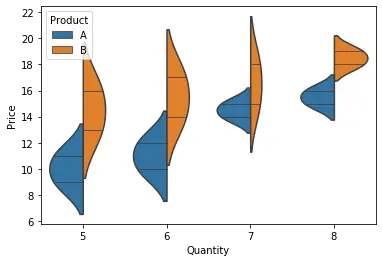
A lot of other arguments can be used to tweak and modify the final figure. We can use the split parameter to compare the categories easily. Their order can be managed using the order parameter. Each observation can be shown inside the plot using the inner parameter.
In the code below, we try to use some of these arguments.
import pandas as pd
import matplotlib.pyplot as plt
import seaborn as sns

df = pd.DataFrame(
    {
        "Quantity": [5, 6, 7, 8, 5, 6, 7, 8, 5, 6, 7, 8, 5, 6, 7, 8],
        "Price": [9, 10, 15, 16, 13, 14, 15, 18, 11, 12, 14, 15, 16, 17, 18, 19],
        "Day": [1, 1, 1, 1, 1, 1, 1, 1, 2, 2, 2, 2, 2, 2, 2, 2],
        "Product": [
            "A",
            "A",
            "A",
            "A",
            "B",
            "B",
            "B",
            "B",
            "A",
            "A",
            "A",
            "A",
            "B",
            "B",
            "B",
            "B",
        ],
    }
)

sns.violinplot(
    data=df, y="Price", x="Quantity", hue="Product", inner="stick", split=True
)
The violinplot() function returns a matplotlib axes-type object to use all such matplotlib functions to customize the final figure. If we want to return a FacetGrid type object, we can use the catplot() function and specify the kind parameter as violin.

Manav is a IT Professional who has a lot of experience as a core developer in many live projects. He is an avid learner who enjoys learning new things and sharing his findings whenever possible.
LinkedIn