How to Create Different Color Palette Using Seaborn

This article will explore different options for the Seaborn color palettes. We will also show you how to create your custom color palette in Seaborn.
Create Different Color Palettes Using Seaborn
Let’s start by importing Seaborn and saving that as seaborn. We will also load some data from the Seaborn library called tips.
import seaborn as seaborn
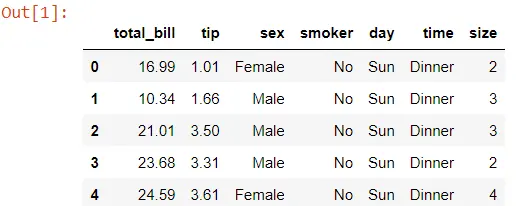
Take a look at the top part of the customer_bill data frame and see that we have different bill amounts and tip amounts left by each customer. We also have different characteristics, like the day of the week or when that meal was served.
customer_bill = seaborn.load_dataset("tips")
customer_bill.head()
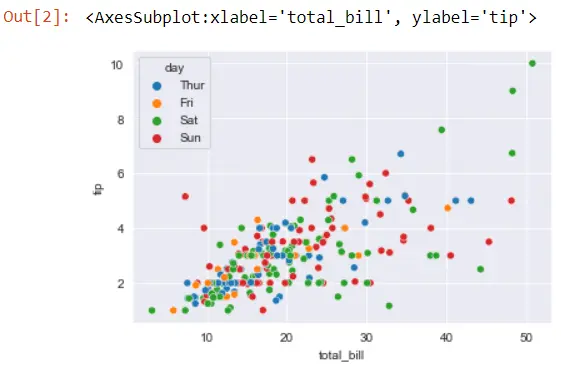
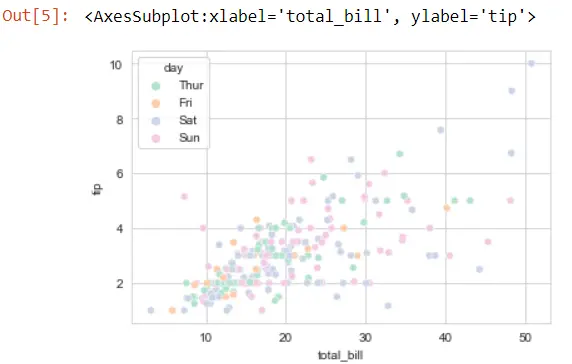
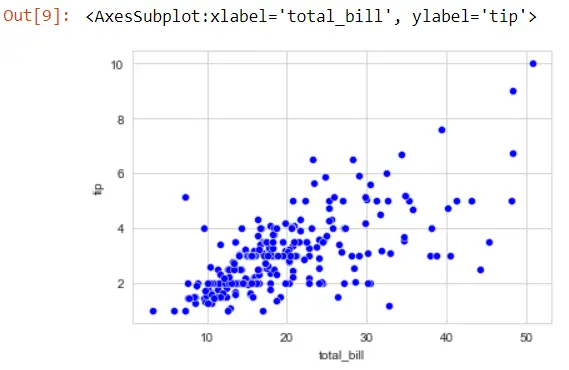
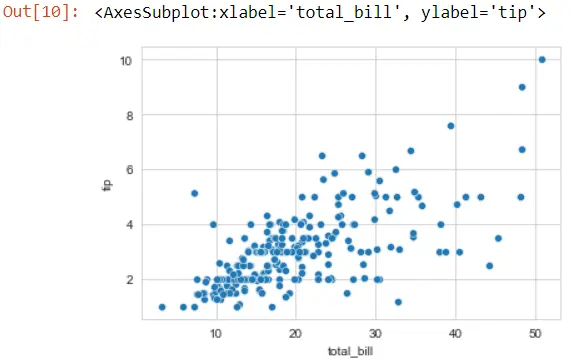
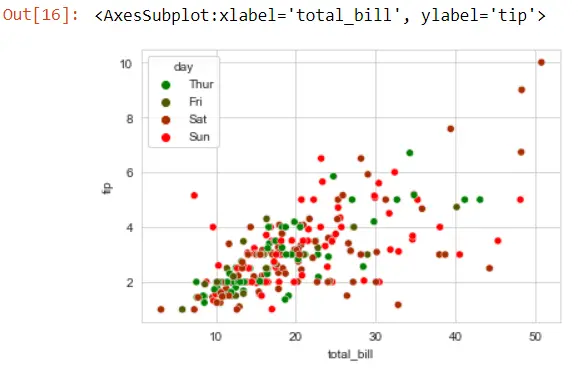
Now we set set_style to be darkgrid and create the scatter plot using the scatterplot function.
In this scatterplot function, we passed the x-axis the total_bill, and the y-axis represents the tip. The data property comes from the customer_bill data frame.
We can also pass another column, a categorical column like day, to the hue property. This will split out in different colors for every single day of the week.
import seaborn as seaborn

# collect data from seaborn
customer_bill = seaborn.load_dataset("tips")
customer_bill.head()
# set grid style
seaborn.set_style("darkgrid")
seaborn.scatterplot(x="total_bill", y="tip", data=customer_bill, hue="day")
# uncomment the below code if you are not using jupyter notebook
# import matplotlib.pyplot as plot
# plot.show()
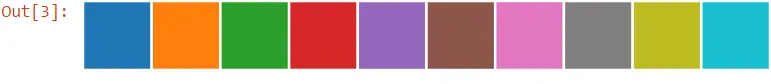
If you notice, Seaborn uses its default color palette in scatter plots. We can check the default Seaborn’s palette using the color_palette() function.
seaborn.color_palette()
This will show you the default color palette Seaborn uses for the first four colors.
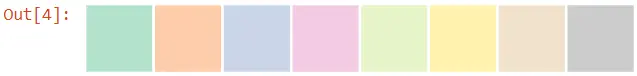
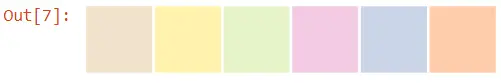
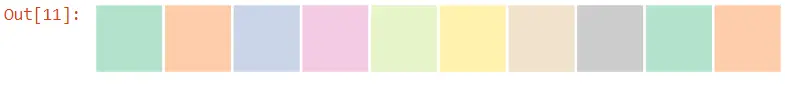
We can pass several options in the color_palette() function. If we pass a valid string name such as Pastel2, we will see the other color palettes.
seaborn.color_palette("Pastel2")
We can use different named color palettes. We only have to add this palette argument and set that equal to a valid palette name.
seaborn.set_style("whitegrid")
seaborn.scatterplot(
    x="total_bill", y="tip", data=customer_bill, hue="day", palette="Pastel2"
)
There are currently 170 different named color palettes that we can use within Seaborn. If you forget their names, you do not have to go look them up; you can pass an invalid palette name such as:
seaborn.scatterplot(
    x="total_bill", y="tip", data=customer_bill, hue="day", palette="GH"
)
Output:
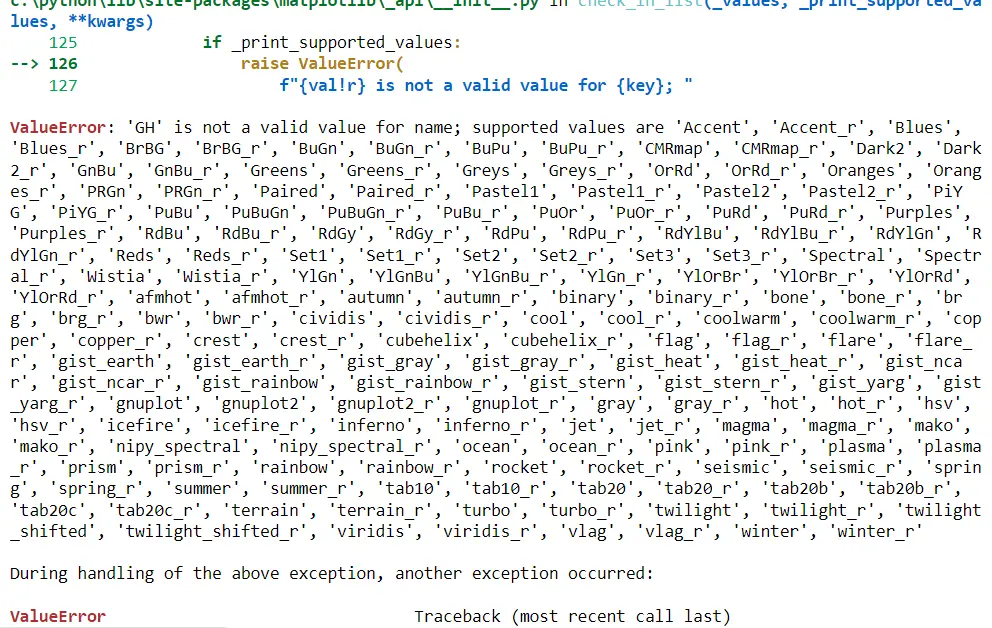
If you notice that a lot of these with _r. These are the same palette but in reversed order.
seaborn.color_palette("Pastel2_r")
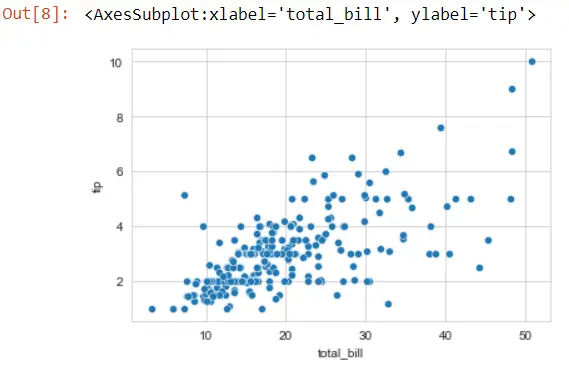
If we do not pass the palette argument, then Seaborn sets the default palette color.
seaborn.scatterplot(x="total_bill", y="tip", data=customer_bill)
If we want to update the color of these dots, we will reference that as color. It is not a palette; it is a color because we have just one color throughout the entire figure, but watch what happens if we switch this color to the string blue.
seaborn.scatterplot(x="total_bill", y="tip", data=customer_bill, color="blue")
This is Matplotlib blue, not Seaborn blue.
Suppose we want to extract the Seaborn blue color using the color_palette() function and pick off the first two colors. This gives us the first tuple, blue, and the second one, orange.
BLUE, ORANGE = seaborn.color_palette()[:2]
seaborn.scatterplot(x="total_bill", y="tip", data=customer_bill, color=BLUE)
Create Custom Color Palette in Seaborn
We can create our custom color palettes in Seaborn based on a single color or blended between multiple colors. We can even create a highlighting palette that emphasizes one particular category.
There are several ways that we can create custom palettes with Seaborn. We can pass an integer if we need additional colors out of this palette.
seaborn.color_palette("Pastel2", 10)
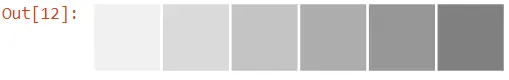
We can also create our color palettes by accessing the light_palette() function, and this method accepts one named color. This palette contains varying shades of one color.
seaborn.light_palette("gray")
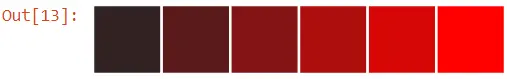
Seaborn has a dark_palette() function that creates a dark palette. The color starts from a darker shade and goes up to the named color.
seaborn.dark_palette("red")
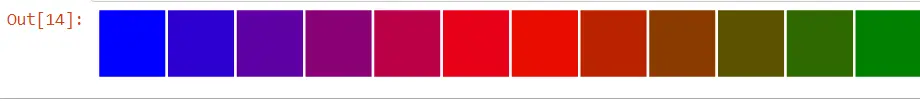
Seaborn also lets us create diverging palettes using this blend_palette() function, and the argument will be a list of colors. This will create a palette that blends between all the colors we have passed on the list.
seaborn.blend_palette(["blue", "red", "green"], 12)
Let’s pass blend_palette() to the palette argument. We may get an error when we do this because the default number of colors for a blend_palette() is six, but we only have four different categories in our day column.
seaborn.scatterplot(
    x="total_bill",
    y="tip",
    data=customer_bill,
    hue="day",
    palette=seaborn.blend_palette(["green", "red"]),
)
Output:
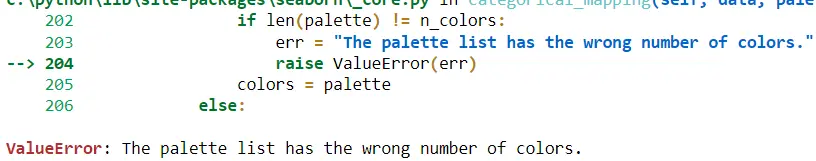
We need to pass an integer as our day columns category exists.
seaborn.scatterplot(
    x="total_bill",
    y="tip",
    data=customer_bill,
    hue="day",
    palette=seaborn.blend_palette(["green", "red"], 4),
)
Seaborn provides us an option to use a highlighting palette, which will be used whenever we want to emphasize one or two categories. We are going to create a palette dictionary for every single unique day.
P_DICT = {k: "gray" for k in customer_bill.day.unique()}
P_DICT
That day’s name will be the key to this dictionary.
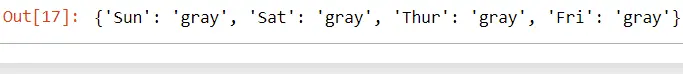
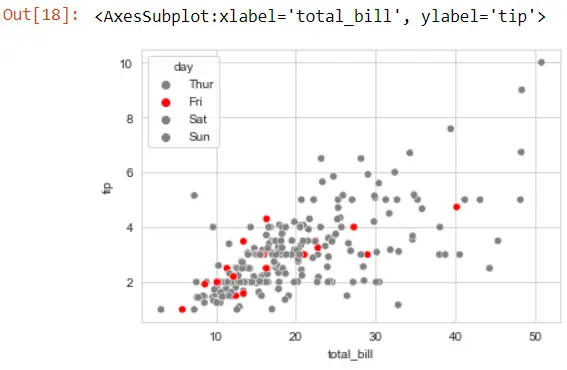
If we want to highlight Friday in our figure, we could assign a new value as red to whatever category we are interested in.
P_DICT["Fri"] = "red"
seaborn.scatterplot(
    x="total_bill", y="tip", data=customer_bill, hue="day", palette=P_DICT
)
We can see that all days are gray except for Friday, colored in red. This can be useful if we want to highlight one particular day.

Hello! I am Salman Bin Mehmood(Baum), a software developer and I help organizations, address complex problems. My expertise lies within back-end, data science and machine learning. I am a lifelong learner, currently working on metaverse, and enrolled in a course building an AI application with python. I love solving problems and developing bug-free software for people. I write content related to python and hot Technologies.
LinkedIn