How to Create Seaborn Boxplot Without Outliers

This article aims to demonstrate what boxplot and outliers are, how to create a modified boxplot, and how to utilize a five-number summary to remove outliers in Seaborn.
Create Boxplot Without Outliers in Seaborn
The boxplot is a statistical plot to visualize a descriptive statistics mean, median quartile 1, quartile 2, quartile 3 and minimum-maximum values. Outliers are numbers outside the group of the rest of the data.
Let’s import the required package into our program.
import seaborn as sb
import matplotlib.pyplot as plot
import numpy as np
import pandas as pd
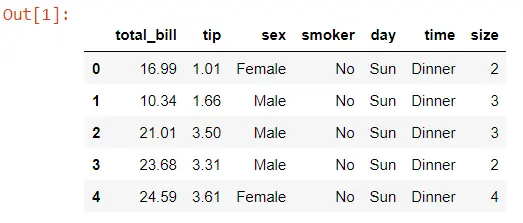
Now we will work on the tips dataset, which is already preloaded in our Seaborn library.
TIPS = sb.load_dataset("tips")
TIPS.head()
Let’s look at the data set; this data set is about a restaurant with several columns.
We need to plot the box plot using the boxplot() method and pass a column from a data set.
import seaborn as sb
import matplotlib.pyplot as plot
import numpy as np
import pandas as pd

TIPS = sb.load_dataset("tips")

sb.boxplot(TIPS["total_bill"])
plot.show()
Output:
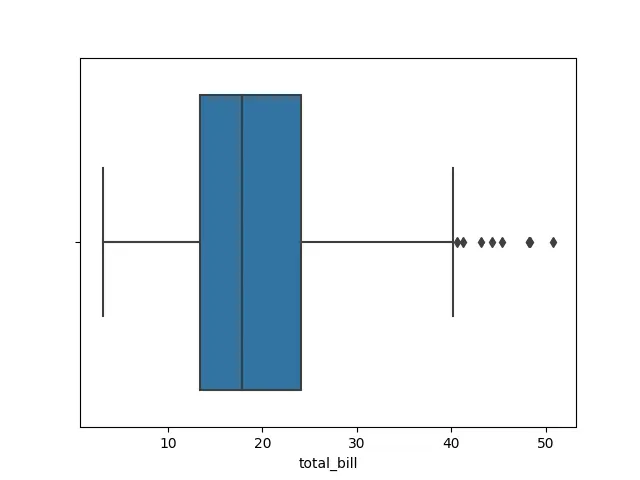
Now we can see the doted points are so far from the rest of all points, so this is like an outlier situation. There is another way to check outliers by calculating the statistics of this column.
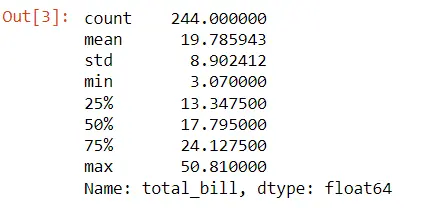
TIPS["total_bill"].describe()
The describe() function automatically calculates statistics, and we can see the third quartile is 24. We can see our maximum value and third quartile have much difference.
Let’s see how to deal with this situation; there are two solutions to remove outliers. The first solution is to directly remove this outlier from a data set, and the second is to replace these outlier values with suitable values.
Let’s see the first solution. We need to set the condition for the first and the third quartiles in this solution.
TIPS = TIPS[(TIPS.total_bill <= 24) & (TIPS.total_bill >= 13)]
The complete source code is here with no outliers.
import seaborn as sb
import matplotlib.pyplot as plot
import numpy as np
import pandas as pd
TIPS = sb.load_dataset("tips")
TIPS = TIPS[(TIPS.total_bill <= 24) & (TIPS.total_bill >= 13)]
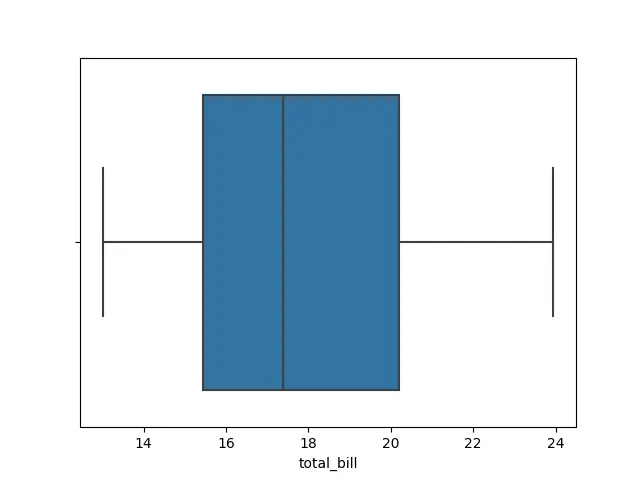
sb.boxplot(TIPS["total_bill"])
plot.show()
Now we can see there is no outlier because we removed this outlier by conditional operators.
The first solution does not work every time. We can convert this outlier into suitable values because we will lose important information from the data set if we remove outliers directly.
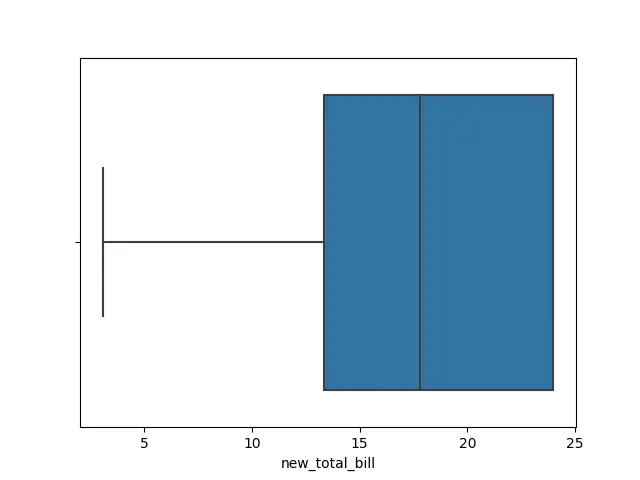
So we need to convert this outlier into suitable values, and we are going to replace the third quartile with 24 if the third quartile range goes out of 24.
TIPS["new_total_bill"] = np.where(TIPS["total_bill"] >= 24, 24, TIPS["total_bill"])
Complete source code:
import seaborn as sb
import matplotlib.pyplot as plot
import numpy as np
import pandas as pd

TIPS = sb.load_dataset("tips")

TIPS["new_total_bill"] = np.where(TIPS["total_bill"] >= 24, 24, TIPS["total_bill"])
sb.boxplot(TIPS["new_total_bill"])
plot.show()
Output:

Hello! I am Salman Bin Mehmood(Baum), a software developer and I help organizations, address complex problems. My expertise lies within back-end, data science and machine learning. I am a lifelong learner, currently working on metaverse, and enrolled in a course building an AI application with python. I love solving problems and developing bug-free software for people. I write content related to python and hot Technologies.
LinkedIn