How to Step Through Python Code
This tutorial will talk about how to use the Python debugger to step through code.
We will explain from scratch about a command-line tool which is called PDB. We will also learn how to step through code with the help of Python IDLE.
Use the pdb Module to Step Through Code in Python
Like other programming languages, Python also has an excellent tool for debugging the Python script, the pdb, which stands for Python Debugger.
It is already installed whenever you install Python on your operating system, so you do not need to install a pdb separately. If you have Python installed, it will work on your terminal.
The pdb module is a tool that will save you an incredible amount of time debugging; it helps us to examine the state of a running program. We can experiment with it, change the values of variables, call functions with different arguments, run snippets of code, and so on.
It is much more powerful than a usual print statement and gives a different picture than testing. Our tests only indicate that our code is not working as expected, whereas debugging allows us to see what happens during the program execution.
Now you might wonder why we are using pdb if we already have the PyCharm IDE and can debug our code on the PyCharm IDE. The reason to use pdb is that sometimes in real-life situations, you will probably run your Python script on some server.
Generally, you don’t have the luxury of using an IDE on these servers. You will have to use the terminal to debug your Python script; that is why we will show you how to debug a Python script using the command-line tool, pdb.
In the pdb module, there is a breakpoint called set_trace(). Using this function, you will have a breakpoint where you can examine different variable values and do whatever you want.
We only need two lines of code inserted into our program, and then we get command line operations that we can do a whole bunch of different things. We will demonstrate this shortly.
Before jumping into the code, we will see a summary of some of the different command line operations.
| Operations | Description |
|---|---|
n |
This will execute the next line of code. |
c |
This operation will continue executing the code and complete execution. |
l |
This operation will list out the 3 lines before and after the line that the execution is on, so you can see where and what three lines are just executed. |
s |
It will let you step into a function call. Now, if you use n when going into a function, it will execute the entire function and proceed to the next line after the function call. |
The s lets you step into a function and run it line by line. |
|
b |
It will allow you to set breakpoints. You can set multiple breakpoints by putting the b command inside the program. |
b[int] |
We can set b followed by an integer to set a breakpoint at a specific line of a number (e.g., b10). |
b[func] |
The b is followed by a function name to set a breakpoint at a function name without the square brackets. |
cl |
It will clear all breakpoints. |
cl[int] |
The cl followed by an integer will clear the breakpoint at a specific line number, and the space is optional. We can put cl10 or cl 10; it does not make any difference. |
p |
We also have the option of printing. Let’s say we have a variable x; if we type it in the Python shell, it will print out the value of x. |
We can use the p statement with the parentheses. Inside the parentheses, we just put a variable. |
There are more operations available. You can read and learn more about it here.
Let’s look at an example where we typed up a little program. It does not do anything; it just sets some variable values, print statements, and does some mathematical functions.
We can see we imported pdb, and then we set a breakpoint using the set_trace() function.
import pdb


def transform(x, y):
    x *= 2
    y = y ** 2
    z = x + y
    return z


x = 50
y = 60
z = 5
n = 1000

pdb.set_trace()
transform(5, 10)
print("z =" + str(z))
n = transform(2, 3)
print("n =" + str(n))
Let’s look at how the program works and how the debugger is used to analyze some functions. So when we execute the program, we see we have entered the Python in the debugger command prompt.
The next line that will execute would be the transform() function, so the first thing we might want to do is look at list l. It will show the previous three lines that are executed and the next three lines to be executed, and it shows where we are located right now that indicates using ->.
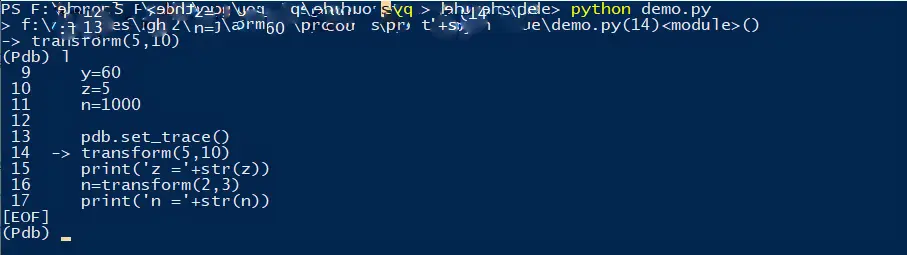
We have the option now of using the n command to execute the next line, which would do the entire transform() function and jump on to line 15. Or, we can use s to step into the transform() function line by line within the transform() function and see what’s happening inside it.
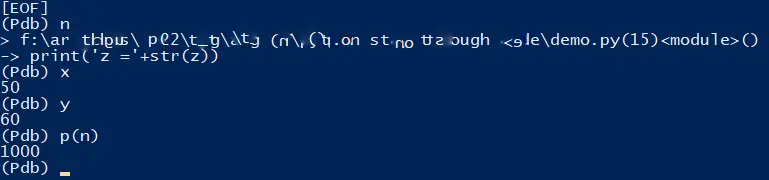
We will use n to see what happened there. Using n, we executed the transform() function.
If we want to print variable values, we can type the variables’ names, but we cannot print out n because n will give us the next execution line.
The alternative would be to use the p() command while putting the n variable inside the parentheses to print its value.
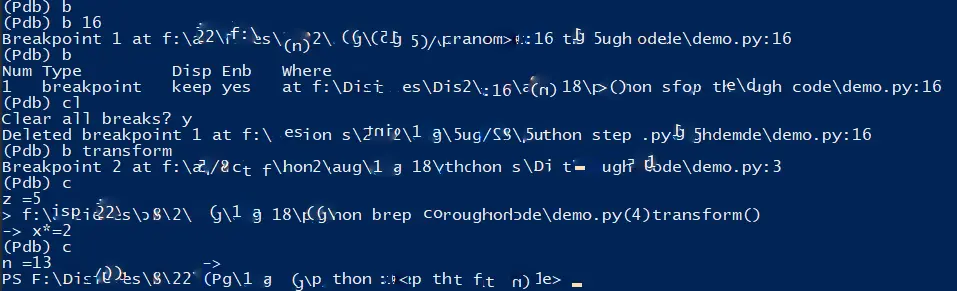
We can also use the b command if we want to look at what other breakpoints we have set, so if we type b, it returns nothing, but we can set another breakpoint at line 16. Now, if we type b, it lists our breakpoints.
The cl will clear all breakpoints. Let’s say yes, so we delete our breakpoints.
We can also set a breakpoint at a function name. If we do that, we will have a breakpoint set at the beginning of the transform() function, so we will step into the transform() function every time we enter that function.
If we put c, it will continue to the next breakpoint, and if again, we put c, that finishes our code.
Debugging into the code can be achieved using the breakpoint() function, a new built-in function introduced in version 3.7.
According to Python official docs, by default, behind the scene we basically call pdb.set_trace() using breakpoint(). We do not need to import pdb and call set_trace(), instead of using this, we can use breakpoint() that works the same.
Use Python IDLE to Step Through Code in Python
This section will show how to debug a Python program using Python IDLE. To demonstrate, we will take an example that adds two numbers.
n1 = int(input("Enter a first number :"))
n2 = int(input("Enter a second number :"))
Res = n1 + n2
print(n1, "+", n2, Res)
To use the debugger in Python IDLE, we first need to switch on the debugger to open up the Python IDLE. After opening the Python IDLE, we can open debug option located at the top.
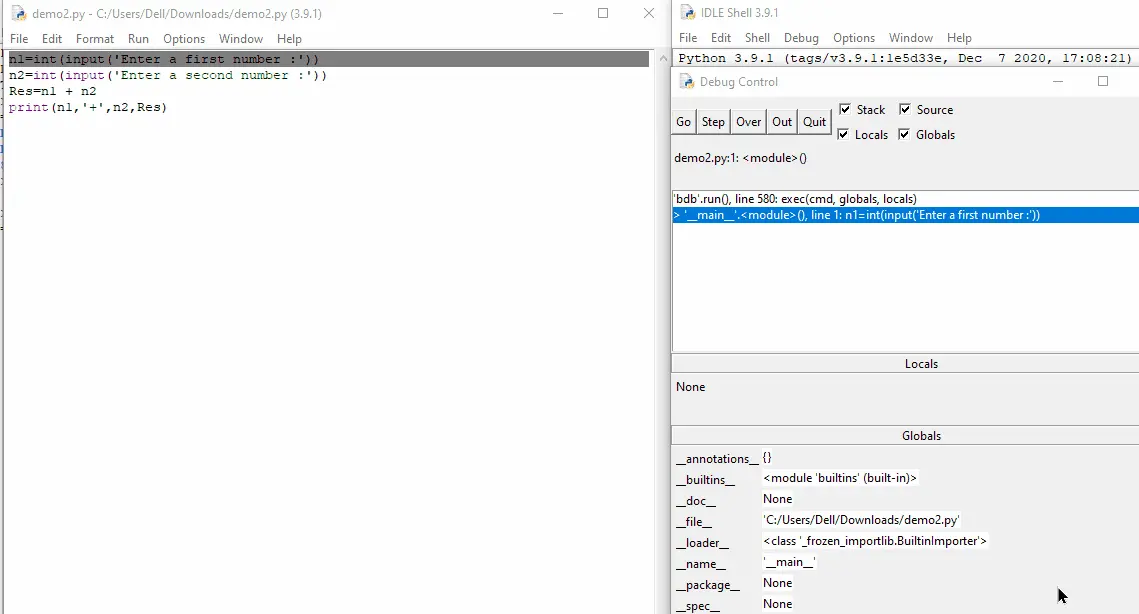
After clicking, it will give a Debug Control window. Here we can see debug is on.
After opening it, we can see the debug control window. This control window is inactive, and we can not click on it anywhere.
We will need to execute the Python script while pressing f5 to make it active.
In debug control window, there are multiple buttons; the names of the buttons are go, step, over, out, and quit. If we press go, it will ask us to enter the input and give the output after putting the input; otherwise, it will be stuck.
Using out assumes you are executing a function so that it will finish the execution of the code and will not show you the step-by-step execution of the program. It will just execute the program and show you the output; it is useful when you want to skip step-by-step execution.
If you want to see how this program works, which line is executed, and how this program flows, then you can use this step or over. The step option will give you all the information about the program.
If we do not want to know how the program works internally and only want to know which line is executing for that, the best option is over. The last one is quit ; if we use quit, it will quit during the execution of a program.
Here is some work of debugger using Python IDLE.

Hello! I am Salman Bin Mehmood(Baum), a software developer and I help organizations, address complex problems. My expertise lies within back-end, data science and machine learning. I am a lifelong learner, currently working on metaverse, and enrolled in a course building an AI application with python. I love solving problems and developing bug-free software for people. I write content related to python and hot Technologies.
LinkedIn