How to Pandas Display DataFrame in a Table Style
-
Display Pandas
DataFramein a Table by Using thedisplay()Function ofIPython.displayModule -
Display Pandas
DataFramein a Table Style Using thetabulateLibrary -
Display Pandas
DataFramein a Table UsingdataFrame.style -
Styling Table for Pandas
DataFrame

Pandas is a very popular and useful data science library. Today, every person that is involved in data science also uses the Pandas extensively. It displays the data in tabular form, which is quite similar to the format we see in the excel tool. Using the excel tool, we can customize our work or data sheets by adding various colors and styles that make them more attractive and readable for other users. Displaying pandas DataFrame via various table styles increases the data visualization.
We will introduce how to display the Pandas DataFrame in the form of tables using different table styles, such as the tabulate library, dataframe.style, and the IPython.display module.
Display Pandas DataFrame in a Table by Using the display() Function of IPython.display Module
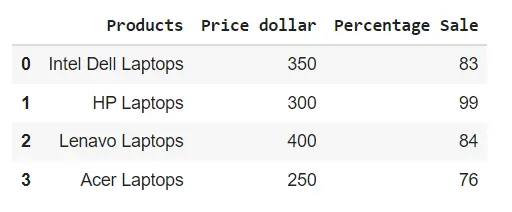
The simplest and easiest way to display pandas DataFrame in a table style is by using the display() function that imports from the IPython.display module. This function displays the DataFrame in an interactive and well-formatted tabular form.
See the following example for a good understanding of the display() function:
Example Codes:
from IPython.display import display
import pandas as pd

# creating a DataFrame
dict = {
    "Products": ["Intel Dell Laptops", "HP Laptops", "Lenavo Laptops", "Acer Laptops"],
    "Price dollar": [350, 300, 400, 250],
    "Percentage Sale": [83, 99, 84, 76],
}
dataframe = pd.DataFrame(dict)

# displaying the DataFrame
display(dataframe)
Output:
Display Pandas DataFrame in a Table Style Using the tabulate Library
Using the above method, we can display the pandas dataframes in an organized table style format. We will use a library known as tabulate. This library consists of different styles in which we can display pandas dataframes.
We will use the pretty style to display pandas DataFrame in the following example:
Example Codes:
import pandas as pd
from tabulate import tabulate

# creating a DataFrame
dict = {
    "Students": ["Intel Dell Laptops", "HP Laptops", "Lenavo Laptops", "Acer Laptops"],
    "Price dollar": [350, 300, 400, 250],
    "Percentage Sale": [83, 99, 84, 76],
}
dataframe = pd.DataFrame(dict)

# displaying the DataFrame
print(tabulate(dataframe, headers="keys", tablefmt="pretty"))
Output:
+---+--------------------+--------------+-----------------+
|   |      Students      | Price dollar | Percentage Sale |
+---+--------------------+--------------+-----------------+
| 0 | Intel Dell Laptops |     350      |       83        |
| 1 |     HP Laptops     |     300      |       99        |
| 2 |   Lenavo Laptops   |     400      |       84        |
| 3 |    Acer Laptops    |     250      |       76        |
+---+--------------------+--------------+-----------------+
The tabulate library contains the following styles that we can use for styling pandas DataFrame:
plainsimplegithubgridfancy_gridpipeorgtbljiraprestoprettypsqlrstmediawikimoinmoinyoutrackhtmllatexlatex_rawlatex_booktabstextile
Display Pandas DataFrame in a Table Using dataFrame.style
We can display the pandas DataFrame in a table style using the Pandas Style API. We will use the dataframe.style in the following code. When we use the dataframe.style, it returns a Styler object containing different formatting methods for displaying pandas dataframes.
Example Codes:
import pandas as pd

# creating a DataFrame
dict = {
    "Students": ["Intel Dell Laptops", "HP Laptops", "Lenavo Laptops", "Acer Laptops"],
    "Price dollar": [350, 300, 400, 250],
    "Percentage Sale": [83, 99, 84, 76],
}
dataframe = pd.DataFrame(dict)

# displaying the DataFrame
dataframe.style
Output:

Styling Table for Pandas DataFrame
To enhance the styling of pandas DataFrame tables, we can use various built-in functions by chaining with the styler object.
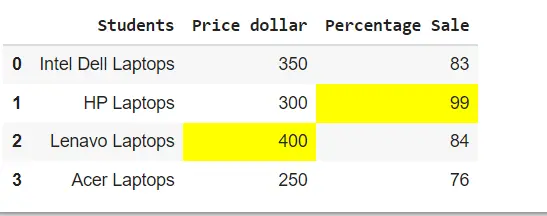
Highlight maximum Values
See the following example in which we used the highliglight_max() function by chaining with the styler object.
Example Codes:
import pandas as pd

# creating a DataFrame
dict = {
    "Students": ["Intel Dell Laptops", "HP Laptops", "Lenavo Laptops", "Acer Laptops"],
    "Price dollar": [350, 300, 400, 250],
    "Percentage Sale": [83, 99, 84, 76],
}
dataframe = pd.DataFrame(dict)

# displaying the DataFrame
dataframe.style.highlight_max()
Output:
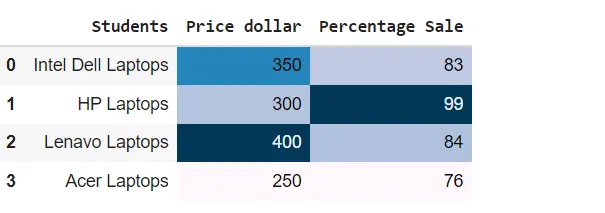
Create heatmaps by Using background_gradient() Function
In the following example we have used the background_gradient() function by chaining with the styler object to create heatmaps within the pandas DataFrame table.
Example Codes:
import pandas as pd

# creating a DataFrame
dict = {
    "Students": ["Intel Dell Laptops", "HP Laptops", "Lenavo Laptops", "Acer Laptops"],
    "Price dollar": [350, 300, 400, 250],
    "Percentage Sale": [83, 99, 84, 76],
}
dataframe = pd.DataFrame(dict)

# displaying the DataFrame
dataframe.style.background_gradient()
Output:
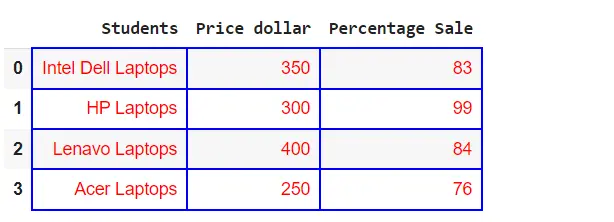
Set table properties in Pandas DataFrame
We can increase the Pandas DataFrame table decoration by using the set_properties() function as follows:
Example Codes:
import pandas as pd

# creating a DataFrame
dict = {
    "Students": ["Intel Dell Laptops", "HP Laptops", "Lenavo Laptops", "Acer Laptops"],
    "Price dollar": [350, 300, 400, 250],
    "Percentage Sale": [83, 99, 84, 76],
}
dataframe = pd.DataFrame(dict)

# displaying the DataFrame
dataframe.style.set_properties(**{"border": "1.5px solid blue", "color": "red"})
Output:
Create Customized Function
We can also use the customized function along with the styler object as follows:
Example Codes:
import pandas as pd
import numpy as np


def table_color(val):
    """
    Takes a scalar and returns a string with
    the css property `'color: red'` for less than 60 marks, green otherwise.
    """
    color = "green" if val > 60 else "red"
    return "color: % s" % color


# creating a DataFrame
dict = {
    "Computer Science": [77, 91, 47, 95],
    "Statistics": [83, 99, 74, 66],
    "English": [71, 67, 40, 55],
}

dataframe = pd.DataFrame(dict)

# displaying the DataFrame
dataframe.style.applymap(table_color)
Output: