How to Use Flask Debug Mode
We will learn, with this explanation, a couple of things we get when we use the debug mode in Flask and how to use an extension that provides a debugger toolbar.
Enable Debug Mode in Flask
The debug mode is for development environments. When you are developing your app, you can use it, but if you have a live version of your app, you want to take the debug mode off.
We created a basic Flask app and turned on debug mode inside the run() method.
from flask import Flask
app = Flask(__name__)
@app.route("/", methods=["GET"])
def Basic_DEBUG():
return "Hi there, debug mode is on"
if __name__ == "__main__":
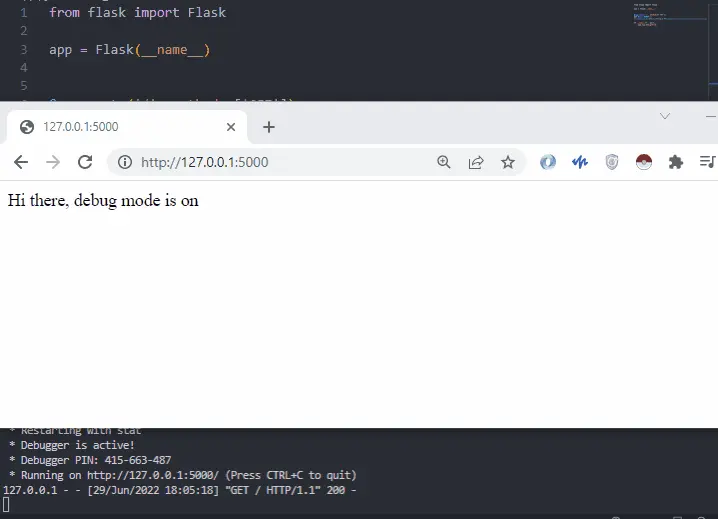
app.run(debug=True)
There are other ways to do it, but for now, we will show you this simple way to debug the Flask app. In the next section, we will learn another way to debug it.
Let’s start the server using this file, and we can see our server is started with debug mode. Now, if we want to make a change to the file and once we save it, the debug mode is going to detect the changes and restart the server automatically.
We do not have to exit this and restart it again. We only have to refresh the page.
Let’s see what happens when something goes wrong while debugging is active. Let’s raise an exception:
from flask import Flask

app = Flask(__name__)


@app.route("/", methods=["GET"])
def Basic_DEBUG():
    CHECK = 6 / 0
    return "Hi there, debug mode is on"


if __name__ == "__main__":
    app.run(debug=True)
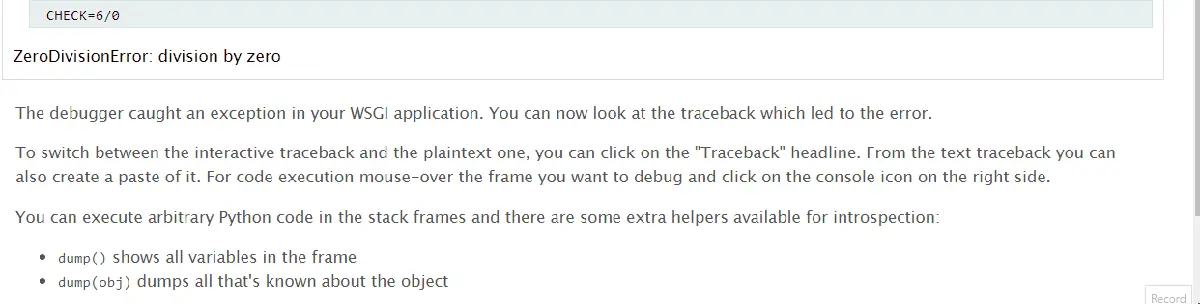
When we save it and refresh the page, it throws a ZeroDivisionError, and we can see a traceback about where it failed. We can view the source of where it failed; when we click here, it shows us the source and has an interactive mode.
It opens up a little console, and you can make some changes here and see why you would not want this in a production environment because anyone can just run the code here.
Render the Debugger Tool With the Help of DebugToolbarExtension
We will get into demonstrating how this works and where we will find it useful when we are developing our Flask apps. We will first need to install this package using the following command.
pip install flask-debugtoolbar
Once that is installed, we will have to set it up in the Flask app; it is a visual toolbar and works with a template. The only way you can use this is if you are using jinja templates, so that is why we will include render_template() and create an HTML file.
Now we are going to deal with the debug toolbar extension. To use it, the first thing we need to import is DebugToolbarExtension; then, we need to set a couple of configurations.
We will set the debug property equal to True, and we need to declare this before we instantiate the toolbar. Then the other configuration value that we need is a SECRET_KEY.
Then we will need to instantiate the debug toolbar called DebugToolbarExtension() and pass it to the app.
TBAR = DebugToolbarExtension(app)
Once we instantiate the debug toolbar, the toolbar will automatically get injected into any template you have returned as a response.
from flask import Flask, render_template
from flask_debugtoolbar import DebugToolbarExtension

app = Flask(__name__)

app.debug = True
app.config["SECRET_KEY"] = "TEST_KEY"
TBAR = DebugToolbarExtension(app)


@app.route("/", methods=["GET"])
def DEBUG_ToolBar():
    return render_template("index.html")


if __name__ == "__main__":
    app.run()
When we refresh the page, the toolbar appears on the right-hand side. It shows us a bunch of useful things we may need when debugging.
The first thing is versions; it tells us what version we are using, and the next one is the time which tells us how long it took to generate this page. You can explore all these variables by yourself.
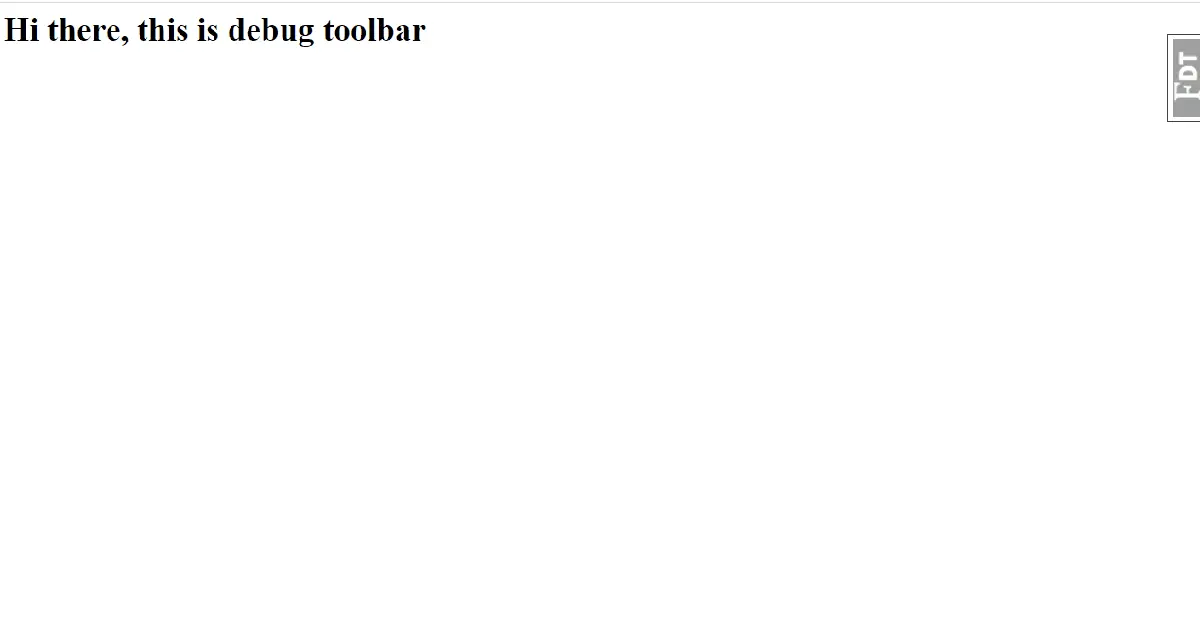
We can see how this feature is useful even though we do not have to look inside our debugger in the console or browser’s developer tools.
Template source code:
<html>
    <head>
        <body>
            <h1>Hi there, this is debug toolbar</h1>
        </body>
    </head>
</html>

Hello! I am Salman Bin Mehmood(Baum), a software developer and I help organizations, address complex problems. My expertise lies within back-end, data science and machine learning. I am a lifelong learner, currently working on metaverse, and enrolled in a course building an AI application with python. I love solving problems and developing bug-free software for people. I write content related to python and hot Technologies.
LinkedIn