Live Graphs Using Dash and Plotly

Python is a dynamically-typed general purpose programming language used in various computer science domains such as machine learning, web development, app development, game development, data science, etc. It is backed by a gigantic community of passionate software engineers and developers building it and creating various APIs and libraries.
One such library is Dash. Dash is a framework built on Flask, Plotly, and ReactJS.
Dash is used to create interactive dashboards with Python programming language.
Live graphs or real-time graphs are those types of graphs that change very frequently in a short interval of time. Applications integrating such graphs can only afford to refresh (reload) the page sometimes; some new data is received because repeatedly loading a huge amount of data is too expensive and heavy for the server and the client machine.
Additionally, it will make the application slow and hard to operate. Stock Charts are the best example of such graphs.
During such situations, a technique, namely, hot loading, is used, which refreshes the modified data without tweaking the application’s state. Note that hot loading differs from live reloading, which means refreshing the whole application (reload) when the data changes.
In this article, we will learn how to create live graphs using Dash with the help of a simple example.
Live Graphs Using Dash and Plotly
We will break the whole procedure into simpler bits to make the development process and understanding easier.
Installing the Dependencies
First, we need to install two dependencies, namely, dash and plotly. Use the following pip commands to install them.
It is highly recommended to create a virtual environment before proceeding with the steps ahead.
pip install dash
pip install plotly
Imports
Now, create a new file, main.py, and add everything that we talked about ahead to that file. Only a single file will be required to create this simple application.
We will import dash, random (for generating random values), plotly, plotly.graph_objs for graph features, dash_core_components for graphs, dash_html_components for HTML components, and Input and Output for callbacks.
import dash
import random
import plotly
import plotly.graph_objs as go  # graph features
import dash_core_components as dcc  # graphs
import dash_html_components as html  # html components
from dash.dependencies import Output, Input  # callbacks
Initialize the Application and Data
Initialize a Dash application and two deque data structures to store x and y coordinates that will be plotted on the graph. Refer to the following Python code for the same.
app = dash.Dash(__name__)

xData = [1]
yData = [1]
Dashboard Layout
To create a dashboard layout, we will use Dash’s HTML components.
app.layout = html.Div(
    [
        dcc.Graph(
            id="live-graph", animate=True  # enable smooth transition upon updation
        ),
        dcc.Interval(
            id="live-graph-interval",
            interval=1000,  # time, in ms, elapsed between two consecutive values
            n_intervals=0,  # number of intervals completed from the start of the server
        ),
    ]
)
Note that we have set animate to True because we need a smooth transition when some new data point is added to the graph. If it is set to False, the graph will update abruptly, which can hamper the user’s experience.
Update the Live Graph
@app.callback(
    Output("live-graph", "figure"), [Input("live-graph-interval", "n_intervals")]
)
def updateGraph(n):
    xx = xData[-1] + 1
    yy = yData[-1] + (yData[-1] * random.uniform(-0.5, 0.5))

    if yy == 0:
        yy = 1

    xData.append(xx)
    yData.append(yy)

    data = plotly.graph_objs.Scatter(
        x=list(xData), y=list(yData), name="Scatter", mode="lines+markers"
    )

    return {
        "data": [data],
        "layout": go.Layout(
            xaxis=dict(range=[min(xData), max(xData)]),
            yaxis=dict(range=[min(yData), max(yData)]),
        ),
    }
Run the Server
Make a call to the run_server() available on the Dash application to run the server.
if __name__ == "__main__":
    app.run_server()
Complete Source Code with the Output
Following is the complete source code, along with the output. Note that a URL will appear as an output upon running the script using python main.py.
Open that URL in any web browser to access the application.
import dash
import random
import plotly
import plotly.graph_objs as go  # graph features
import dash_core_components as dcc  # graphs
import dash_html_components as html  # html components
from dash.dependencies import Output, Input  # callbacks

app = dash.Dash(__name__)

xData = [1]
yData = [1]

app.layout = html.Div(
    [
        dcc.Graph(
            id="live-graph", animate=True  # enable smooth transition upon updation
        ),
        dcc.Interval(
            id="live-graph-interval",
            interval=1000,  # time, in ms, elapsed between two consecutive values
            n_intervals=0,  # number of intervals completed from the start of the server
        ),
    ]
)


@app.callback(
    Output("live-graph", "figure"), [Input("live-graph-interval", "n_intervals")]
)
def updateGraph(n):
    xx = xData[-1] + 1
    yy = yData[-1] + (yData[-1] * random.uniform(-0.5, 0.5))

    if yy == 0:
        yy = 1

    xData.append(xx)
    yData.append(yy)

    data = plotly.graph_objs.Scatter(
        x=list(xData), y=list(yData), name="Scatter", mode="lines+markers"
    )

    return {
        "data": [data],
        "layout": go.Layout(
            xaxis=dict(range=[min(xData), max(xData)]),
            yaxis=dict(range=[min(yData), max(yData)]),
        ),
    }


if __name__ == "__main__":
    app.run_server()
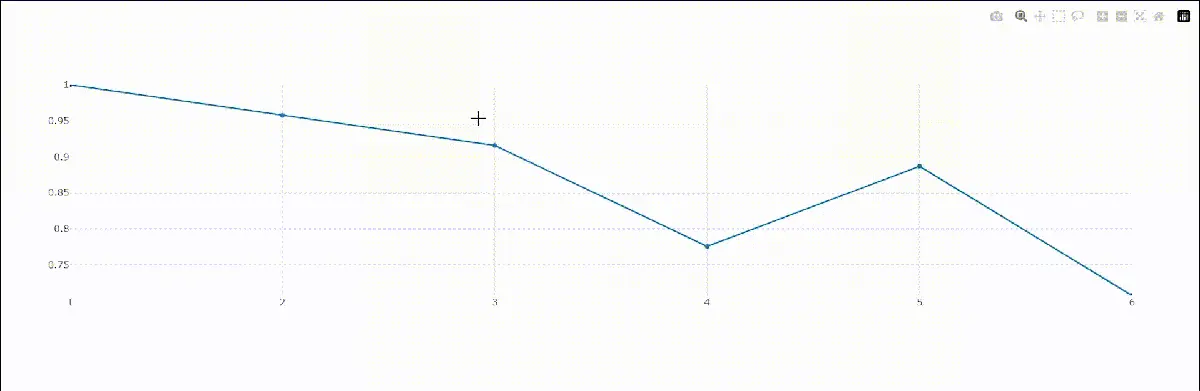
Output:

Vaibhav is an artificial intelligence and cloud computing stan. He likes to build end-to-end full-stack web and mobile applications. Besides computer science and technology, he loves playing cricket and badminton, going on bike rides, and doodling.