Magic Function Inline in Matplotlib
In this demonstration, we will learn what a magic function is then we will see different magic functions available in Matplotlib. After this, we discuss the inline function.
Use Inline Magic Function in Matplotlib
Interactive Python provides several predefined functions called magic functions, and these magic functions can be used callable by a command-line and style syntax. There are two types of magic functions called line-oriented and cell-oriented.
The line-oriented is also called line magic, and these functions start with the % sign followed by an argument in the rest of the line without any quotation or a parenthesis. If we are in the interactive Python, we can also say "ipython" session, which means jupyter notebook.
Below is the syntax to call the function.
%matplotlib [gui]
Here the [gui] is the name of the Matplotlib backend to be enabled by calling the function. If we want to see the list of available Matplotlib packages, we should use the following command.
Command:
%matplotlib -l
Output:
Available matplotlib backends: ['tk', 'gtk', 'gtk3', 'gtk4', 'wx', 'qt4', 'qt5', 'qt6', 'qt', 'osx', 'nbagg', 'notebook', 'agg', 'svg', 'pdf', 'ps', 'inline', 'ipympl', 'widget']
The command below is another way to check it, and it will also show the same result as above.
%matplotlib --list
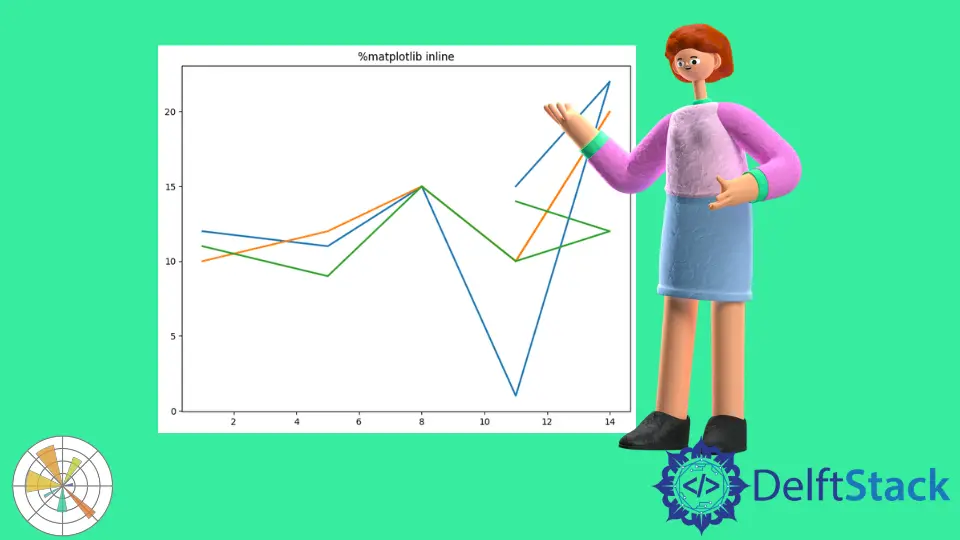
Now we will discuss the magic function %matplotlib inline to enable the inline plotting where the plots and the graphs will be displayed just below the cell. Suppose we want to change the color of the plot by using the color map it will not affect the previous plot.
Let’s learn how to use this inline function in the jupyter notebook, so here is the example. If we execute the program, you will see the plot here, and we can see how it looks.
Code:
from matplotlib import pyplot as plt

# %matplotlib inline

x1 = [1, 5, 8, 11, 14, 11]
y1 = [12, 11, 15, 1, 22, 15]
y2 = [10, 12, 15, 10, 20, 10]
y3 = [11, 9, 15, 10, 12, 14]

plt.figure(figsize=[9, 7])

plt.title("%matplotlib inline")
plt.plot(x1, y1, linewidth=2, label="sin()")
plt.plot(x1, y2, linewidth=2, label="cos()")
plt.plot(x1, y3, linewidth=2, label="tan()")
Output:
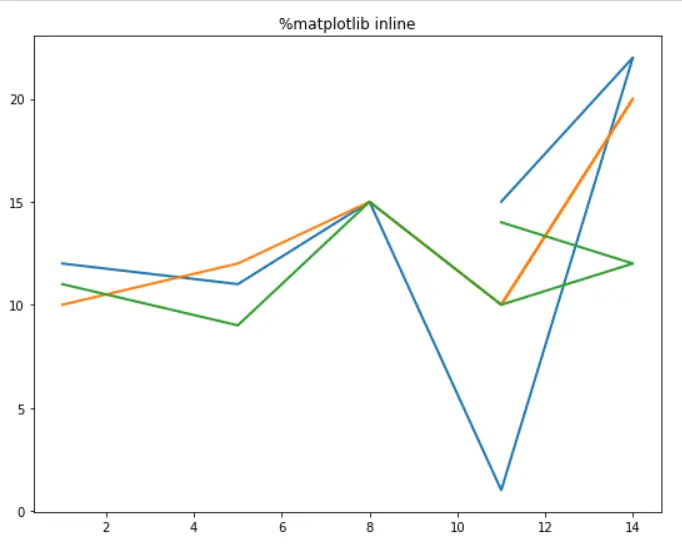
If you are using the current version of an ipython notebook and the jupyter notebook, it is unnecessary to use the inline function. Whether you call the Matplotlib show() function or not, the graph output will display in any case.
Code:
from matplotlib import pyplot as plt

x1 = [1, 5, 8, 11, 14, 11]
y1 = [12, 11, 15, 1, 22, 15]
y2 = [10, 12, 15, 10, 20, 10]
y3 = [11, 9, 15, 10, 12, 14]

plt.figure(figsize=[9, 7])

plt.title("%matplotlib inline")
plt.plot(x1, y1, linewidth=2, label="sin()")
plt.plot(x1, y2, linewidth=2, label="cos()")
plt.plot(x1, y3, linewidth=2, label="tan()")
If you are trying to use this Matplotlib inline in pycharm, it will show you the syntax error, but if you want to use it in Visual Studio, you need to add the extension "jupyter note".

Hello! I am Salman Bin Mehmood(Baum), a software developer and I help organizations, address complex problems. My expertise lies within back-end, data science and machine learning. I am a lifelong learner, currently working on metaverse, and enrolled in a course building an AI application with python. I love solving problems and developing bug-free software for people. I write content related to python and hot Technologies.
LinkedIn