Matplotlib Triangulation
Python’s Matplotlib toolkit is complete for building static, animated, and interactive visualizations. It makes difficult things possible, such as producing plots fit for publishing and making interactive charts with zoom, pan, and update capabilities.
Matplotlib Triangulation
To plot triangulation, Matplotlib offers libraries and functions. A surface or plane polygon is divided into several triangles in this way.
Typically, each triangle vertex is shared by two neighboring triangles.
Python’s ability to plot a continuous surface is enabled via the triangulation idea. Triangles can have user-defined coordinates or have the collection of points in a triangle that sustains the surface plot covered by Delaunay triangulation.
This post will teach us about Matplotlib triangulation. The function matplotlib.pyplot.triplot(), which at the very least accepts two arguments—x and y data points—is necessary to plot triangulation.
n points and ntri triangles form an unstructured triangular grid.
The triangles can be created automatically using a Delaunay triangulation or by the user specifying them (generate a mesh of triangles that covers an object).
Let’s create a random triangle:
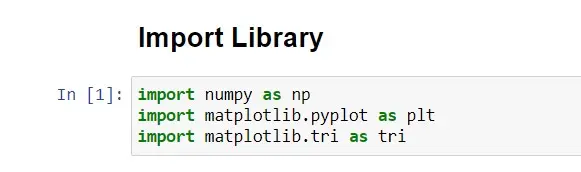
First, you must import the required libraries, such as Matplotlib, NumPy, etc.
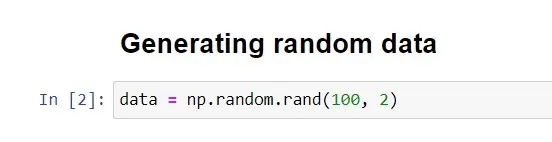
As we are generating random triangles, let’s first generate random data for the triangles.
For demonstration purposes, the following code is used to create a random cloud of points:
We ensure that triangulation is genuine before producing the data for the Matplotlib triangulation plot. It cannot contain triangles made up of collinear points, identical points, or triangles that overlap.
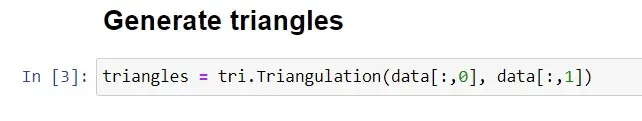
In the matplotlib.tri function, triangles are produced using the function triangulation(), which requires at least two parameters, x and y data points.
We may plot the triangulation using the matplotlib.pyplot.triplot() method on a figure.
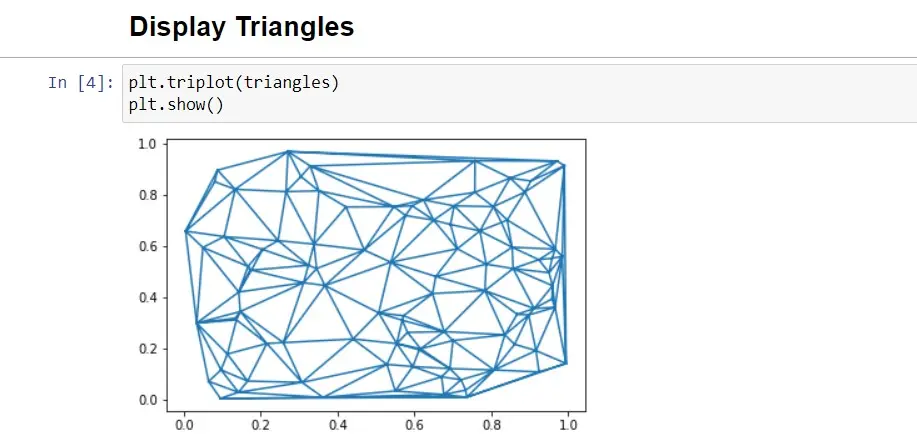
As the triangulated cloud of points is produced randomly, you will observe a new triangulation each time the script is executed.
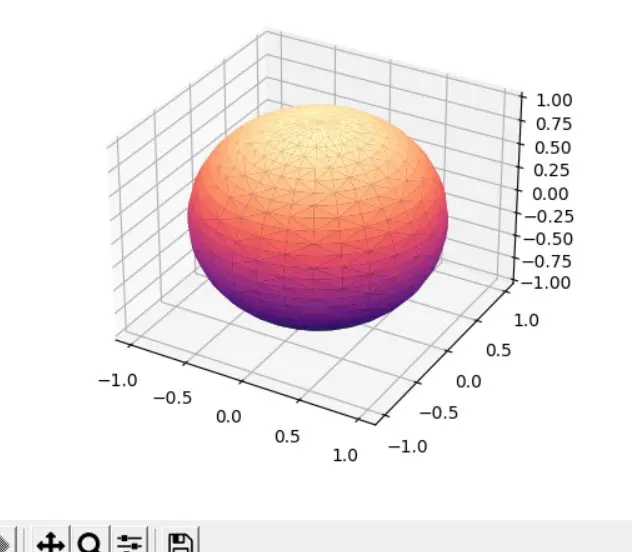
Let’s execute Matplotlib triangulation in 3D spaces. In this section, we will plot the sphere using Matplotlib triangulation.
We must parameterize the sphere to draw a sphere using triangulation. We must take the outer product of the two vectors cos(a) and sin(b) on the x-axis, sin(a) and sin(b) on the y-axis, and cos() on the z-axis (b).
A list of evenly spaced numbers from 0 to 2π is given in column a, and a list of equally spaced numbers from 0 to π is given in column b.
The following code uses Matplotlib triangulation to plot a sphere:
import numpy as np
from scipy.spatial import Delaunay
import matplotlib.pyplot as plt
from matplotlib import cm
from mpl_toolkits.mplot3d import Axes3D

ax = plt.figure().gca(projection="3d")


def triangulateSphere(ax, k=30, cmap=cm.magma):

    # domain parametrization
    U = np.linspace(0, 2 * np.pi, k)
    V = np.linspace(0, np.pi, k)
    [X, Y] = np.meshgrid(U, V)

    # sphere parametrization
    S1 = np.cos(X) * np.sin(Y)
    S2 = np.sin(X) * np.sin(Y)
    S3 = np.cos(Y)

    # triangulate the points in [0,2pi] x [0,pi]
    tri = Delaunay(np.array([X.flatten(), Y.flatten()]).T)

    # plot the sphere
    ax.plot_trisurf(
        S1.flatten(), S2.flatten(), S3.flatten(), triangles=tri.simplices, cmap=cmap
    )


triangulateSphere(ax)
plt.show()
First, we imported the required modules and set up the figure size. After that, ax = plt.figure().gca(projection='3d') changes the figure from 2D to 3D.
The method numpy.linspace() produced 30 evenly spaced numbers for the lists U and V. The function numpy.meshgrid() accepts a 1D array encoding the coordinates of a grid as an input and returns the coordinate matrices from the coordinate vector.
The vectors (cos(a) and sin(b)), (sin(a) and sin(b)), and (array of ones and cos(b)) correspondingly yielded the lists S1, S2, and S3.
The triangulated sphere plot is displayed using the matplotlib.pyplot.show() function. As the parameter k increases, more points are defined, resulting in smaller triangles and a smoother sphere.
Running the code will result in this:

Shiv is a self-driven and passionate Machine learning Learner who is innovative in application design, development, testing, and deployment and provides program requirements into sustainable advanced technical solutions through JavaScript, Python, and other programs for continuous improvement of AI technologies.
LinkedIn