Matplotlib Retina
Matplotlib is a Python library that can produce high-quality 2D and 3D plots. One of its key features is its support for retina displays with high pixel-density screens.
This makes matplotlib plots look sharp and clear, especially on laptop and mobile screens. There are two main ways to use matplotlib with the retina display.
- The
%matplotlib inlinemagic command - Configure
matplotlibto use a backend
Matplotlib for Python
Matplotlib aims to produce publication-quality 2D graphics for scientific publications and presentations. For interactive work, matplotlib includes several graphical user interface toolkits.
The default Matplotlib backend is used to create static PNGs. It has publication quality figures in various hardcopy formats and interactive environments across platforms.
Some of the features of matplotlib are:
- Support for various backends
- Plotting with a GUI
- Basic plotting
- Plotting with a
notebook - Plotting with a
server - Plotting with an application
- Plotting with a library
It is designed to be as flexible as possible. The user can choose from various backends, including matplotlib’s backend, which supports a wide range of output devices, such as PNG, PDF, SVG, JPG, GIF, and interactive backends.
Further, it has several add-on tools, such as:
- An animation package
- A toolkit for creating vector graphics
- A toolkit for creating publication-quality plots
- A set for working with matrices
- A set of tools for operating with images
- A set of tools for performing with 3D data
Retina in Python
The retina is a high-resolution display device. It is a display device consisting of a grid of individual pixel units used to produce an image.
In the back side of the eye, the retina is present and is reliable for transforming light into electrical impulses sent to the brain.
Use Python matplotlib Retina
Matplotlib retina graph is a high-resolution graph that can generate using the Matplotlib library. This graph is utilized to visualize the data more precisely and concisely.
The retina graph can generate using the pyplot module of the Matplotlib library. This module helps create 2-dimensional graphs.
The retina graph is created using the plot() function of the pyplot module.
So, this function is used to plot the data on the graph. The data is plotted on the graph using the line() function.
This function is used to draw the line on the graph.
So, the retina graph can generate by using the show() function of the pyplot module. This function is used to display the graph on the screen.
There are two main ways to use matplotlib with a Retina display:
- Use the
%matplotlib inlinemagic command to render figures directly in the notebook. - Configure
matplotlibto use a backend that supports Retina displays.
the %matplotlib inline Magic Command
This way is the easiest to use, but it has the drawback that all figures will be rendered at a lower resolution since they are displayed in the notebook.
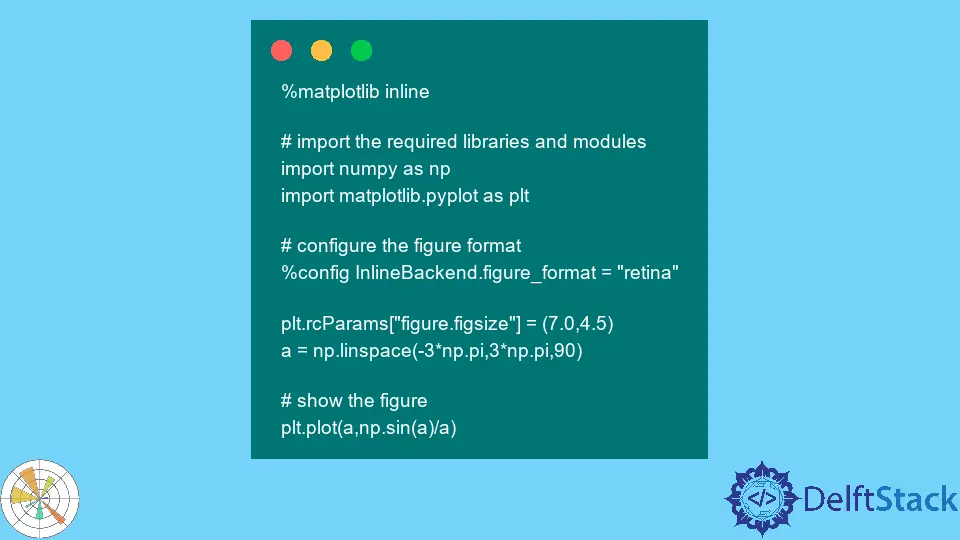
# %matplotlib inline
# import the required libraries and modules
import numpy as np
import matplotlib.pyplot as plt
# configure the figure format
%config InlineBackend.figure_format = "retina"
plt.rcParams["figure.figsize"] = (7.0, 4.5)
a = np.linspace(-3*np.pi, 3*np.pi, 90)
# show the figure
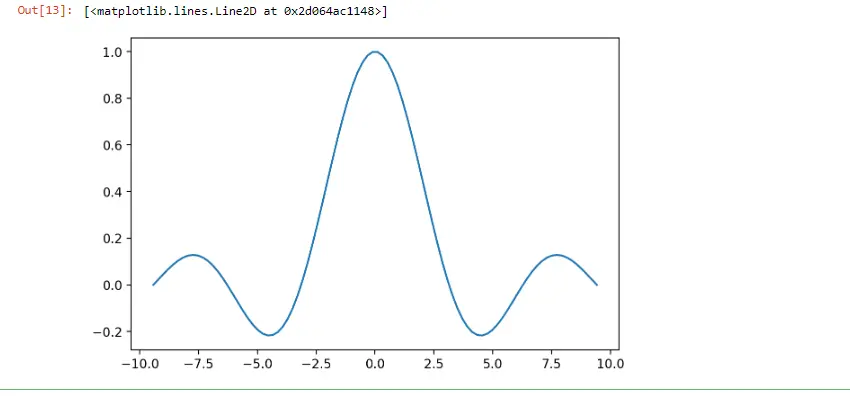
plt.plot(a, np.sin(a)/a)
Output:
Configure matplotlib
This option requires a bit more configuration but will result in higher-quality figures. To configure matplotlib to use a backend that supports Retina displays, you will need to edit your matplotlibrc file.
- On a Mac, this file is located at
~/.matplotlib/matplotlibrc. - On Windows, this file is found at
C:\Users<username>.matplotlib\matplotlibrc. - On Linux, this file is located at
~/.config/matplotlib/matplotlibrc.
You will need to add the following lines to your matplotlibrc file:
backend: TkAgg
tk.window_focus()
fig.set_size_inches(7, 5)
Once you have edited your matplotlibrc file, you will need to restart your notebook kernel for the changes to take effect.
# %matplotlib inline
# import libraries
import numpy as np
import matplotlib.pyplot as plt
# configure the file format, and set it to "retina"
%config InlineBackend.figure_format = "retina"
thetaValue = np.linspace(2, 7*np.pi, 200)
# create array
arrSize = 10*np.ones(200)
a = np.random.rand(200)
b = thetaValue*np.cos(thetaValue)
c = thetaValue*np.sin(thetaValue)
# display figure
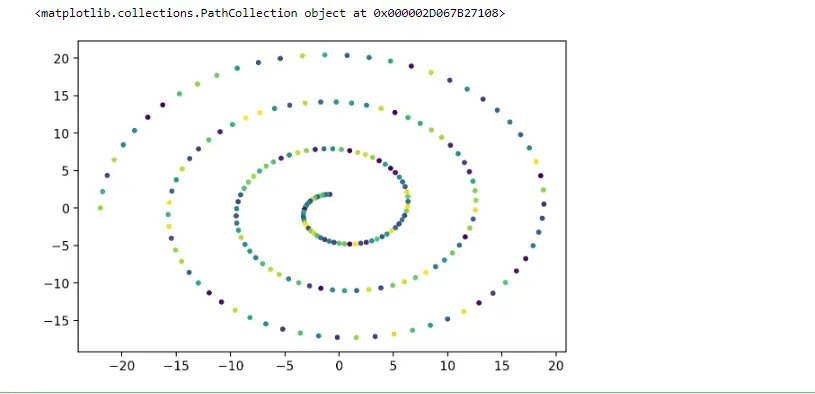
print(plt.scatter(b, c, arrSize, a))
Output:
Conclusion
You’ve probably been frustrated if you’ve tried to get reasonable customization for your charts in Matplotlib.
From this article, you can see that Matplotlib produces high-quality figures like many of the publications in the field of data visualization. The default format is PDF, and many others are supported.
The basic usage is simple, create a figure, add some axes, plot some data on the axes, and then call the show to display the figure.

Zeeshan is a detail oriented software engineer that helps companies and individuals make their lives and easier with software solutions.
LinkedIn