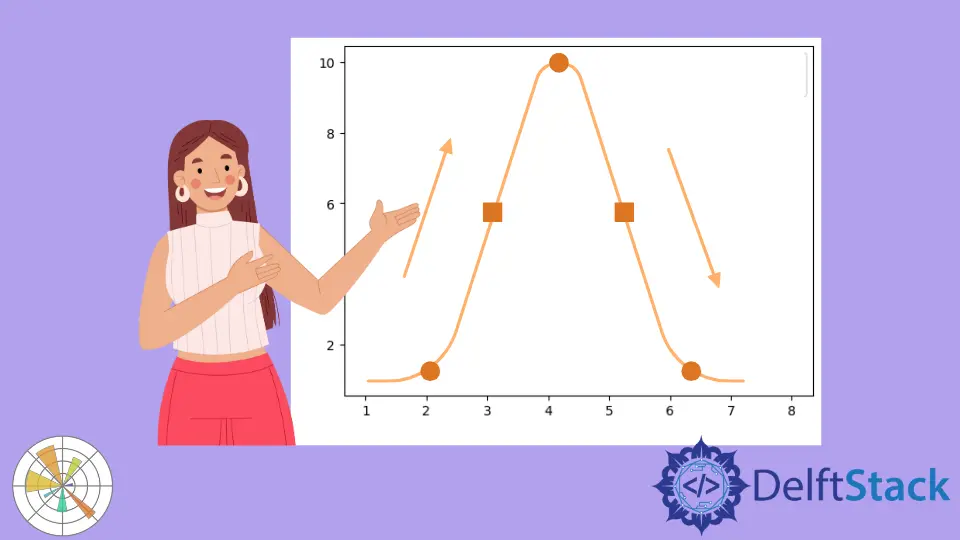
How to Create Animation in Matplotlib

In Matplotlib, you can create visualizations that respond to user input, such as mouse clicks or key presses. Interactive visualizations may create using the same techniques as animations.
The Matplotlib Animation
Matplotlib is a library used for 2D plotting, but it also includes functions for creating animations, and the matplotlib.animation module makes it easy to create animations.
The animation function takes a figure and an animation function. The animation function will call for each frame of the animation.
The figure is a container for the axes, artists, and the canvas. The axes are where the plot will draw, and the artists are the objects that will draw on the canvas.
The animation function may call with an interval argument that specifies the number of milliseconds between frames, and the default value is 1000. The matplotlib.animation module also includes a function for creating a movie.
The movie function takes a figure and an animation function.
Install Matplotlib in Python
There are several ways to install Matplotlib. The easiest way is to use the pip command.
pip install matplotlib
To install Matplotlib, you will need a working installation of the numpy library. Again we will use the famous pip command.
pip install numpy
Once you have numPy installed, you can install Matplotlib from its source code. Finally, run the following command.
python setup.py install
You must have administrator privileges if you want to install Matplotlib for all users on your system. On Linux, you can do this by running the command.
sudo python setup.py install
On Windows, you will need to run the command.
python setup.py install
If you want to install matplotlib for a single user, you can use the --user flag.
python setup.py install --user
Create Animation in Matplotlib
Creating an animation in Matplotlib is relatively simple and involves using the FuncAnimation class. To create an animation, you must first create a figure and an axes instance.
The figure will create using the pyplot.figure() function, and the axes will create using the pyplot.axes() function.
Once you have created the figure and axes, you can use the FuncAnimation class to animate the figure.
The FuncAnimation class requires an animation function, which must be defined before the animation will create. The animation function must take in a single parameter: the frame number.
The frame number determines the figure’s appearance at each animation step. The animation function can contain any plotting code, which will be executed once the frame number is updated.
To create the animation, you must call the anim = FuncAnimation(fig, func, frames=frames) function, where the fig is the figure and func is the animation function.
The frames argument is optional and is used to specify the number of frames in the animation. If not specified, the animation will run until the figure is closed.
Code Example:
# import the required libraries and modules

import matplotlib.pyplot as plt
from matplotlib.animation import FuncAnimation
import numpy as np

fig = plt.figure()
ax = plt.axes(xlim=(0, 4), ylim=(-2, 2))
(ln,) = ax.plot([], [], "bo")
xdata, ydata = [], []


def init():
    ax.set_xlim(0, 2 * np.pi)
    ax.set_ylim(-1, 1)
    return (ln,)


def update(frame):
    xdata.append(frame)
    ydata.append(np.sin(frame))
    ln.set_data(xdata, ydata)
    return (ln,)


anim = FuncAnimation(
    fig, update, frames=np.linspace(0, 2 * np.pi, 128), init_func=init, blit=True
)
anim.save("animation.gif", writer="imagemagick", fps=60)
Output:

Conclusion
To conclude the article on Matplotlib animation, we have discussed how to create animation using the matplotlib library in Python. So you can create animation in a very simple way.
The above article shows that first, create the FuncAnimation class. Then you will create a figure and an axes instance. So from these steps, you can make an animation graph.
Zeeshan is a detail oriented software engineer that helps companies and individuals make their lives and easier with software solutions.
LinkedIn