How to Use Error Bar in Python Matplotlib

This tutorial will discuss plotting data with error bars using the errorbar() function of Matplotlib in Python.
Python Error Bar
Some values are not one hundred percent accurate, and they contain some errors like the values of resistors. The resistor values have tolerance or error like 10%. That means the value is not exact, but it can change in the 10% range.
Error bars in Python are used to plot errors along with data points in a plot to show the error present in a value. To plot data with error bars in Python, we can use the errorbar() function of the Matplotlib.
For example, let’s plot some random data and add error bars to each value. See the code below.
import matplotlib.pyplot as plt

x_values = [1, 2, 3, 4]
y_values = [1, 2, 3, 4]
y_error = [0.9, 0.5, 0.75, 0.25]

plt.errorbar(x_values, y_values, yerr=y_error)
plt.show()
Output:

In this example, we only added errors on the y-axis, but we can also add errors to the x-axis. The bars in the above output are vertical, but in case of x-axis error, the bars will be horizontal.
The length of each bar depends on the value of the error specified with it. The size of the error vectors should be the same as the data vectors.
The errorbar() function has an argument fmt that can set the properties of the line used in the plot like the line style, color, and marker symbol.
The default line style is solid, but we can change it to the dashed line --, the dash-dot line -., or the dotted line :. The default color is blue, but we can change it to any color like green or red using the first letter of the color like r for red.
We can also add a marker symbol like o for circle, d for diamond, and * for star marker. We can use the ms argument to change the size of the marker.
For example, let’s add an x-axis error in the above plot and change the line style, color, and marker. See the code below.
import matplotlib.pyplot as plt

x_values = [1, 2, 3, 4]
y_values = [1, 2, 3, 4]
y_error = [0.9, 0.5, 0.75, 0.25]
x_error = [0.5, 0.5, 0.5, 0.5]

plt.errorbar(x_values, y_values, yerr=y_error, xerr=x_error, fmt="--ro", ms=10)
plt.show()
Output:
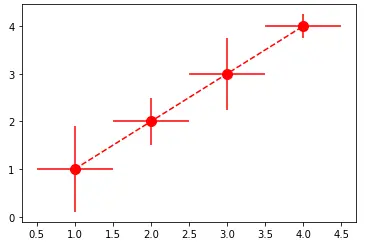
We can also change other marker properties like the marker edge color using the markeredgecolor or mec parameter, the marker face color using the markerfacecolor or mfc the marker edge width using the markeredgewidth or mew argument.
We can also change the properties of the error bars like color, line width, caps size, and caps thickness of the error bars. By default, the color of the error bars will be the same as the color of the line style, but we can change it to any color using the color name or the first letter of the color name and using the ecolor parameter.
By default, the width of the error bars will be the same as the width of the line style, but we can change it to any width using the elinewidth parameter. By default, the cape size and thickness are zero, but we can change it to any floating-point value using the capsize and capthick parameters.
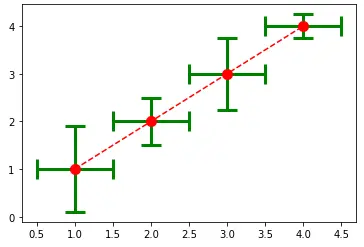
For example, let’s change the properties mentioned above of the error bars. See the code below.
import matplotlib.pyplot as plt

x_values = [1, 2, 3, 4]
y_values = [1, 2, 3, 4]
y_error = [0.9, 0.5, 0.75, 0.25]
x_error = [0.5, 0.5, 0.5, 0.5]

plt.errorbar(
    x_values,
    y_values,
    yerr=y_error,
    xerr=x_error,
    fmt="--ro",
    ms=10,
    ecolor="g",
    elinewidth=3,
    capsize=10,
    capthick=3,
)
plt.show()
Output:
We can also hide error bars on certain points using the errorevery argument. By default, the value of this argument is 1, but we can change it to an integer value. For example, if we set the value of the errorevery argument to 2, the error bars will appear on half of the points.
