How to Plot Venn Diagram in Matplotlib
This tutorial will discuss how you can generate Venn diagrams using Python and the Matplotlib library.
Create Venn Diagrams With Matplotlib in Python
The Matplotlib library enables you to generate two circle and three-circle Venn diagrams using some specific functions. Using particular commands, we can generate weighted, unweighted, and tunable circles for Venn diagrams.
The tunable circles allow you to further annotate or add additional information to your Venn diagrams.
The first one we will tackle is a two-circle Venn diagram so let’s get started. If the matplotlib-venn is not installed on your pc, install it using the following command.
pip install matplotlib-venn
Then we import our required libraries. Let’s create a list called items and labels with two labels.
import matplotlib.pyplot as plot
from matplotlib_venn import venn2, venn2_circles, venn2_unweighted

items = [80, 43, 6]
labels = ["set1", "set2"]
The venn2() function is weighted plots that generate the circles, and the size is dependent on the values that we have given in this items list. This function takes a few arguments.
The first argument is subsets that accept a list we pass that we have created above. The second argument is set_labels, which accepts a list of labels and passes it to the labels list.
The third argument is set_colors, where we can choose to add color to the Venn diagram, and the color values depend on the labels, so keep it the same quantity as the labels list of items.
We can also set the transparency using the alpha parameter. This parameter range is 0 to 1, and we can pass the float value between 0 to 1.
venn2(subsets=items, set_labels=labels, set_colors=("red", "green"), alpha=0.7)
Full Code:
import matplotlib.pyplot as plot
from matplotlib_venn import venn2, venn2_circles, venn2_unweighted

items = [80, 43, 6]
labels = ["set1", "set2"]
venn2(subsets=items, set_labels=labels, set_colors=("red", "green"), alpha=0.7)
plot.title("2 weighted venn diagram")
plot.show()
Output:
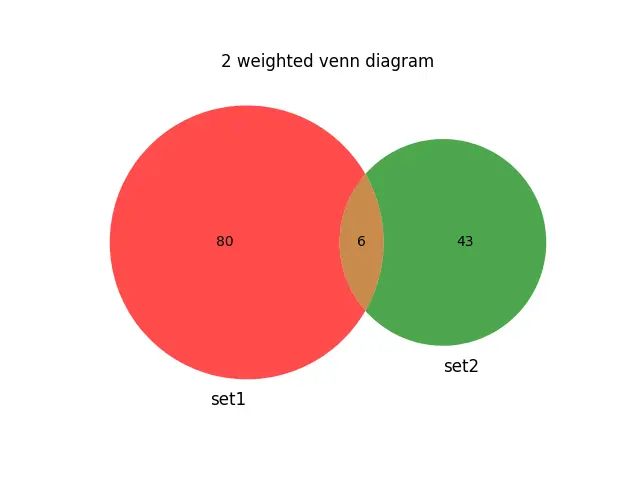
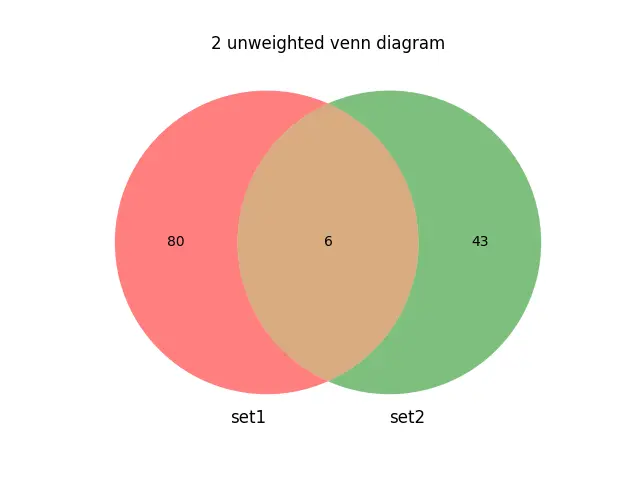
The weighted Venn diagram shows that the front side is very small. If we want to keep the same size of two Venn diagram circles, we can use the venn2_unweighted() function, which accepts the same parameter as the venn2() function.
Code:
import matplotlib.pyplot as plot
from matplotlib_venn import venn2, venn2_circles, venn2_unweighted

items = [80, 43, 6]
labels = ["set1", "set2"]
venn2_unweighted(
    subsets=items, set_labels=labels, set_colors=("red", "green"), alpha=0.5
)
plot.title("2 unweighted venn diagram")
plot.show()
Output:
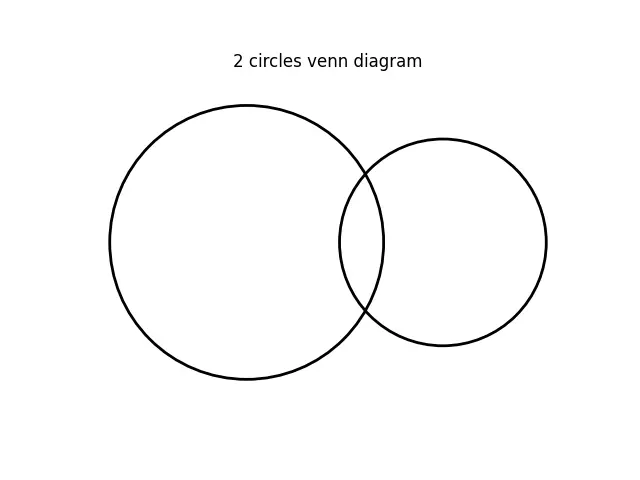
The next example uses the venn2_circles() function that generates blank two circles where you can’t further do the annotation for this diagram. This method does not acceptsset_labels and set_colors parameters.
Code:
import matplotlib.pyplot as plot
from matplotlib_venn import venn2, venn2_circles, venn2_unweighted

items = [80, 43, 6]
labels = ["set1", "set2"]
venn2_circles(subsets=items)
plot.title("2 circles venn diagram")
plot.show()
Output:
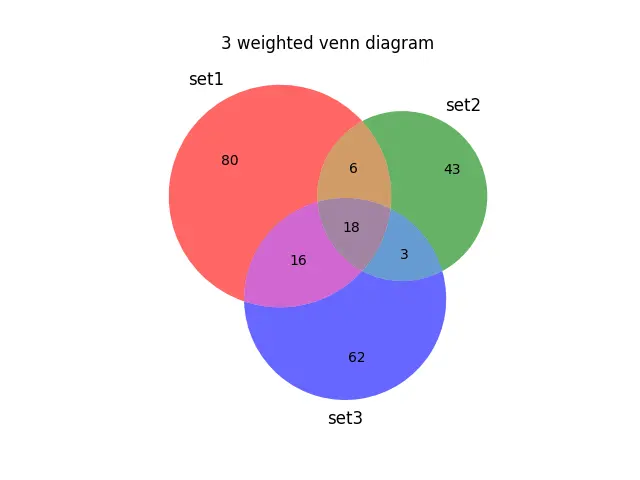
Now let’s move on to the three-circle Venn diagrams. The three-circle Venn diagram takes three sets.
The items should be entered in the following order.
items=[a,b,ab,c,ac,bc,abc]
Let’s create a new item list for three sets and labels.
items = [80, 43, 6, 62, 16, 3, 18]
labels = ["set1", "set2", "set3"]
In this three Venn diagram, we can observe the intersection parts.
Code:
import matplotlib.pyplot as plot
from matplotlib_venn import venn3, venn3_unweighted

items = [80, 43, 6, 62, 16, 3, 18]
labels = ["set1", "set2", "set3"]

venn3(subsets=items, set_labels=labels, alpha=0.6)
plot.title("3 weighted venn diagram")
plot.show()
Output:
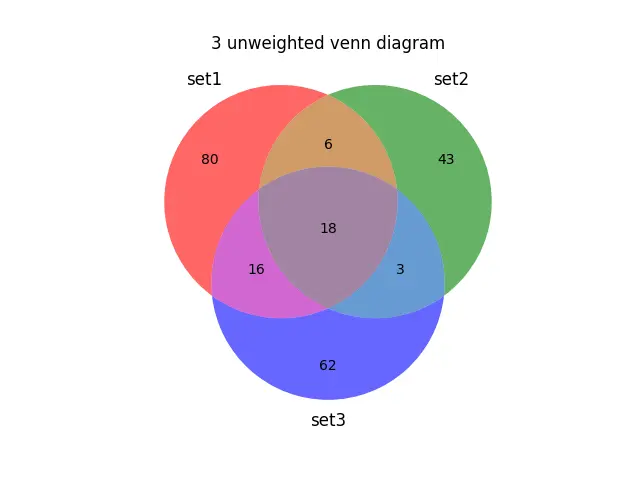
We can also create three unweighted Venn diagrams using the venn3_unweighted() function like the following example.
Code:
import matplotlib.pyplot as plot
from matplotlib_venn import venn3, venn3_unweighted

items = [80, 43, 6, 62, 16, 3, 18]
labels = ["set1", "set2", "set3"]

venn3_unweighted(subsets=items, set_labels=labels, alpha=0.6)
plot.title("3 unweighted venn diagram")

plot.show()
Output:
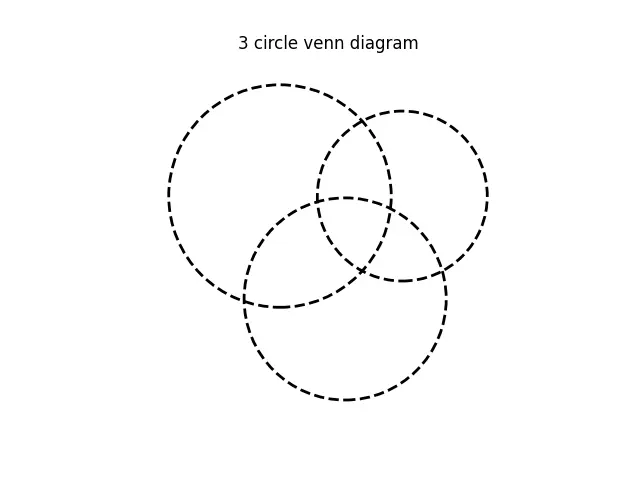
Lastly, we can create a three-circle diagram using the venn3_circles function.
Code:
import matplotlib.pyplot as plot
from matplotlib_venn import venn3_circles

items = [80, 43, 6, 62, 16, 3, 18]
labels = ["set1", "set2", "set3"]

venn3_circles(subsets=items, linestyle="dashed")
plot.title("3 circle venn diagram")

plot.show()
Output:

Hello! I am Salman Bin Mehmood(Baum), a software developer and I help organizations, address complex problems. My expertise lies within back-end, data science and machine learning. I am a lifelong learner, currently working on metaverse, and enrolled in a course building an AI application with python. I love solving problems and developing bug-free software for people. I write content related to python and hot Technologies.
LinkedIn