Matplotlib Marker Fill

This explanation will look at how to customize marker style, create a filled marker, and create a plot with different line styles in Matplotlib.
Create Filled and Unfilled Marker in Matplotlib
The marker represents the points on a graph. It can be a single character string or an integer number.
We can customize marker style and size using these two parameters, the first one is a marker and the second one is markersize. The marker has several styles to point out on graphs.
| Value | Description |
|---|---|
| 9 | An integer number 9 will mark the data points using the triangles pointing to the right. |
| + | A string with a + character will mark the data points using the + sign. |
| x | A string with the lowercase letter x will mark the data points using unfilled crosses. |
| X | A string with an uppercase letter X will mark the data points using filled crosses. |
| 4 | An integer number 4 will mark the data points using the triangles pointing to the left. |
| s | A string with the lowercase letter s will mark the data points using squares. |
| d | A string with the lowercase letter d will mark the data points using diamonds. |
| P | A string with an uppercase letter P will mark the data points using filled plus signs. |
| p | A string with the lowercase letter p will mark the data points using polygons. |
| h | A string with the lowercase letter h will mark the data points using hexagons. |
| H | A string with an uppercase letter H will mark the data points using filled hexagons. |
| o | A string with the lowercase letter o will mark the data points using owl shapes. |
Let’s see an example that uses line colors, styles, and markers.
We need to import numpy, and We also need to import matplotlib.pyplot. Next, we create the data arrays, where X contains 15 points evenly distributed between negative pi and positive pi, and the C contains the cosine values of X and S contains the sine values of X.
import numpy as np
import matplotlib.pyplot as plot

X = np.linspace(-np.pi, np.pi, 15)
C = np.cos(X)
S = np.sin(X)
Then, let’s create a figure with a figsize is 5 inches by 4 inches and a dpi is 80. We need to create four axes using the subplot function with 2 rows and 2 columns.
In the first axes, we plot the cosine function. The line color is navy, the linestyle is a densely dashed line, the marker is a star, and the markersize is 8.
plot.subplot(2, 2, 1)
plot.plot(X, C, color="navy", linestyle=(0, (5, 1)), marker="*", markersize=8)
In the second axes, we plot the sine function. The line color is "orangered", the marker is a cross, and the markersize is 8.
plot.subplot(2, 2, 2)
plot.plot(
    X, S, color="orangered", linestyle=(0, (3, 1, 1, 1)), marker="x", markersize=8
)
In the third axes, we plot the negative cosine function. The line color is "darkgreen", the linestyle is a solid line, the marker is a circle, and the marker size is 8.
plot.subplot(2, 2, 3)
plot.plot(X, -C, color="darkgreen", linestyle=(0, ()), marker="o", markersize=8)
In the fourth axes, we plot the negative sine function. The line color is firebrick, and the linestyle is a densely dotted line, the marker is a plus sign, and the marker size is 8.
plot.subplot(2, 2, 4)
plot.plot(X, -S, color="firebrick", linestyle=(0, (1, 1)), marker="p", markersize=8)
Full Source Code:
import numpy as np
import matplotlib.pyplot as plot
X = np.linspace(-np.pi, np.pi, 15)
C = np.cos(X)
S = np.sin(X)
fig = plot.figure(figsize=(5, 4), dpi=80)
plot.subplot(2, 2, 1)
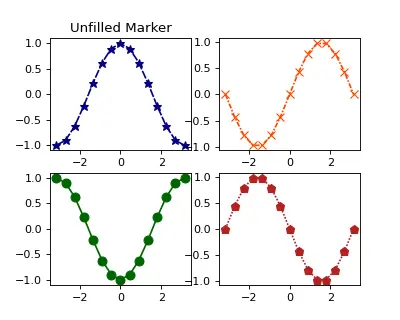
plot.title("Unfilled Marker")
plot.plot(X, C, color="navy", linestyle=(0, (5, 1)), marker="*", markersize=8)
plot.subplot(2, 2, 2)
plot.plot(
X, S, color="orangered", linestyle=(0, (3, 1, 1, 1)), marker="x", markersize=8
)
plot.subplot(2, 2, 3)
plot.plot(X, -C, color="darkgreen", linestyle=(0, ()), marker="o", markersize=8)
plot.subplot(2, 2, 4)
plot.plot(X, -S, color="firebrick", linestyle=(0, (1, 1)), marker="p", markersize=8)
plot.show()
Output:
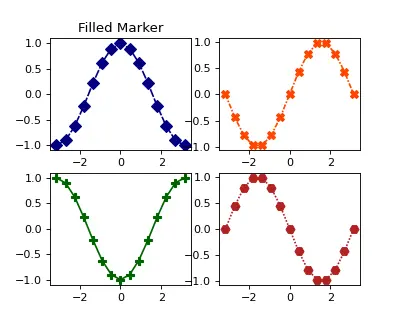
The following is an example of filling markers with different characters.
Code:
import numpy as np
import matplotlib.pyplot as plot

X = np.linspace(-np.pi, np.pi, 15)
C = np.cos(X)
S = np.sin(X)
fig = plot.figure(figsize=(5, 4), dpi=80)

plot.subplot(2, 2, 1)
plot.title("Filled Marker")
plot.plot(X, C, color="navy", linestyle=(0, (5, 1)), marker="D", markersize=8)
plot.subplot(2, 2, 2)
plot.plot(
    X, S, color="orangered", linestyle=(0, (3, 1, 1, 1)), marker="X", markersize=8
)
plot.subplot(2, 2, 3)
plot.plot(X, -C, color="darkgreen", linestyle=(0, ()), marker="P", markersize=8)
plot.subplot(2, 2, 4)
plot.plot(X, -S, color="firebrick", linestyle=(0, (1, 1)), marker="H", markersize=8)
plot.show()
Output:
Click here to read more about filled and unfilled marker styles.

Hello! I am Salman Bin Mehmood(Baum), a software developer and I help organizations, address complex problems. My expertise lies within back-end, data science and machine learning. I am a lifelong learner, currently working on metaverse, and enrolled in a course building an AI application with python. I love solving problems and developing bug-free software for people. I write content related to python and hot Technologies.
LinkedIn