How to Create Low Pass Filter in MATLAB
- Understanding Low Pass Filters
- Using the lowpass() Function in MATLAB
- Customizing the Low Pass Filter
- Conclusion
- FAQ
Creating a low pass filter in MATLAB is a fundamental skill for anyone working with signal processing. Whether you’re filtering audio signals, removing noise from data, or simply experimenting with different frequency components, understanding how to design and implement a low pass filter is crucial. MATLAB provides a straightforward way to accomplish this through its built-in lowpass() function, which simplifies the process of filtering signals.
In this article, we’ll walk you through the steps to create a low pass filter in MATLAB. You’ll learn how to use the lowpass() function effectively, and we’ll provide code examples to illustrate the concepts. By the end of this guide, you’ll have a solid understanding of how to filter signals using MATLAB, which can enhance your projects and improve your signal processing skills.
Understanding Low Pass Filters
A low pass filter allows signals with a frequency lower than a certain cutoff frequency to pass through while attenuating frequencies higher than the cutoff. This functionality is essential in various applications, including audio processing, communications, and data analysis. In MATLAB, the lowpass() function makes it easy to design and apply a low pass filter to your data.
The lowpass() function takes in parameters such as the data to be filtered and the cutoff frequency. It can also accept options for the filter design, such as the filter order and the sample rate. By adjusting these parameters, you can tailor the filter to meet the specific needs of your project.
Using the lowpass() Function in MATLAB
To create a low pass filter in MATLAB, you can utilize the lowpass() function. Below is a simple example that demonstrates how to apply this function to a noisy signal.
fs = 1000; % Sampling frequency
t = 0:1/fs:1-1/fs; % Time vector
signal = sin(2*pi*50*t) + randn(size(t)); % Noisy signal
cutoffFreq = 100; % Cutoff frequency

filteredSignal = lowpass(signal, cutoffFreq, fs); % Apply lowpass filter

figure;
subplot(2,1,1);
plot(t, signal);
title('Noisy Signal');
xlabel('Time (s)');
ylabel('Amplitude');

subplot(2,1,2);
plot(t, filteredSignal);
title('Filtered Signal');
xlabel('Time (s)');
ylabel('Amplitude');
In this code, we first define the sampling frequency and create a time vector. We then generate a noisy signal by adding random noise to a sine wave. The lowpass() function is called with the noisy signal, the desired cutoff frequency, and the sampling frequency. Finally, the original and filtered signals are plotted for comparison.
Output:
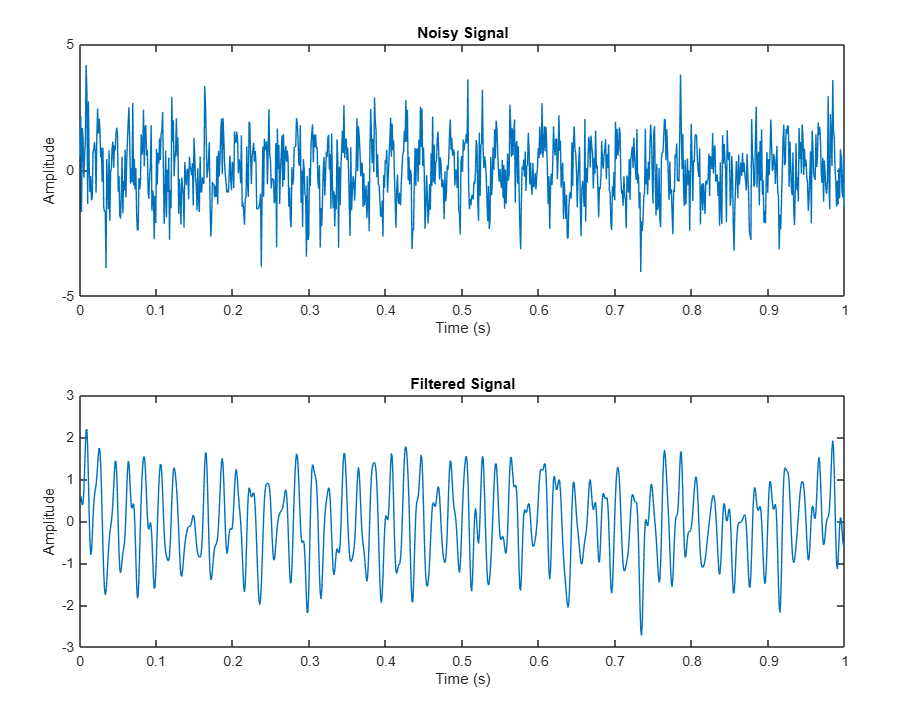
The lowpass() function effectively removes high-frequency noise from the signal while preserving the lower frequency components. This is particularly useful in applications where clarity and precision are essential, such as audio processing or biomedical signal analysis.
Customizing the Low Pass Filter
You can customize the low pass filter further by adjusting the filter order and other parameters. The lowpass() function allows you to specify the filter design method, which can impact the filter’s performance. Here’s an example of how to create a low pass filter with a specified filter order.
fs = 1000; % Sampling frequency
t = 0:1/fs:1-1/fs; % Time vector
signal = sin(2*pi*50*t) + randn(size(t)); % Noisy signal
cutoffFreq = 100; % Cutoff frequency
filterOrder = 6; % Filter order

% Convert cutoff frequency to normalized form (0 to 1 range)
normalizedCutoff = cutoffFreq / (fs / 2);

% Design a Butterworth lowpass filter
d = designfilt('lowpassiir', ...
               'FilterOrder', filterOrder, ...
               'HalfPowerFrequency', normalizedCutoff, ...
               'DesignMethod', 'butter');


% Apply the filter
filteredSignal = filter(d, signal);

figure;
subplot(2,1,1);
plot(t, signal);
title('Noisy Signal');
xlabel('Time (s)');
ylabel('Amplitude');

subplot(2,1,2);
plot(t, filteredSignal);
title('Filtered Signal with Custom Order');
xlabel('Time (s)');
ylabel('Amplitude');
In this example, we’ve introduced a filter order parameter. A higher filter order typically results in a steeper roll-off, which can improve the filter’s ability to attenuate unwanted frequencies. However, it can also introduce more phase distortion, so it’s essential to find a balance that suits your application.
Output:
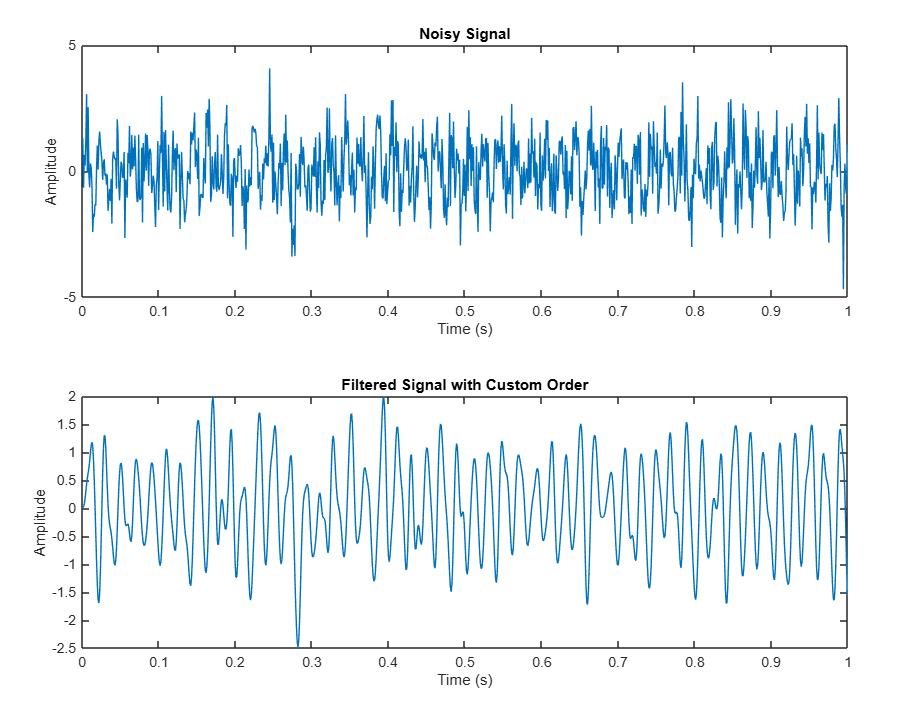
By experimenting with different filter orders and designs, you can fine-tune your low pass filter to achieve the desired performance for your specific needs.
Conclusion
Creating a low pass filter in MATLAB is a straightforward process that can significantly enhance your signal processing capabilities. By using the lowpass() function, you can easily filter out unwanted high-frequency noise while preserving the essential characteristics of your signal. Whether you are working on audio processing, communications, or scientific data analysis, mastering this technique will undoubtedly benefit your projects.
As you continue to explore MATLAB’s powerful capabilities, remember to experiment with different parameters and filter designs to find the best fit for your specific applications. With practice, you’ll become proficient at designing filters that meet your needs.
FAQ
-
What is a low pass filter?
A low pass filter allows signals with a frequency lower than a specified cutoff frequency to pass through while attenuating higher frequencies. -
How does the lowpass() function work in MATLAB?
The lowpass() function in MATLAB applies a low pass filter to a given signal, requiring the signal data, cutoff frequency, and sampling frequency as inputs. -
Can I customize the filter order in MATLAB?
Yes, you can customize the filter order in the lowpass() function, which affects the steepness of the filter’s roll-off. -
What applications can benefit from low pass filtering?
Low pass filtering is commonly used in audio processing, communications, biomedical signal analysis, and data smoothing to reduce noise. -
Is it possible to visualize the effects of filtering in MATLAB?
Yes, you can use MATLAB’s plotting functions to visualize both the original and filtered signals, allowing you to compare their characteristics.
