How to Change Properties of a Figure in MATLAB
-
Use the
exportgraphicsFunction to Change the Image or Figure’s Size -
Use the
exportgraphicsFunction to Change the Image or Plot Figure’s Resolution -
Use the
exportgraphicsFunction to Change the Image or Figure’s Background Color

We will look at different ways to change your desired figure’s size, resolution, background color in MATLAB. We will use different example codes and related outputs to clear your concepts and give you a complete insight into methods to set your figure’s size, resolution, background color, or figure in MATLAB.
The easiest way is to use the exportgraphics function provided by MATLAB. We can use the exportgraphics tool to export plots in documents/publications such as articles or PowerPoint slides.
We can use this method to save figures at the correct size, quality, and background color according to any requirements.
As we know, that picture comprises pixels, and crop emphasizes the reduction in pixels resulting in the loss of information. When using the exportgraphics function, the stored data is cropped closely along the x-axis and y-axis with a screen background.
The stored content excludes all UI elements and neighboring objects such as panels of our plot figure.
Use the exportgraphics Function to Change the Image or Figure’s Size
The exportgraphics function records material at the same width and height as it appears on your screen. If you wish to modify the width and height, change the size of the content in the figure.
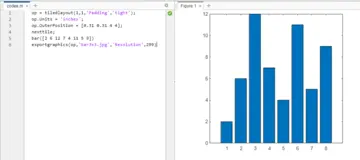
One method generates the plot in a tiled chart style with no padding at the required size. The layout is then sent to the exportgraphics method. To save a bar chart as a 3-by-3-inch square picture, for example, create a tiled-chart and set our Padding option to tight.
op = tiledlayout(1,1,'Padding','tight');
op.Units = 'inches';
op.OuterPosition = [0.31 0.31 4 4];
nexttile;
bar([2 6 12 7 4 11 5 9])
exportgraphics(op,'bar3x3.jpg','Resolution',299)
Output:
Use the exportgraphics Function to Change the Image or Plot Figure’s Resolution
As we all know, images are stored at DPI (dots-per-inch) by definition. So, to export a plot figure with the specified resolution, we may use the exportgraphics function and declare it using a name-value-pair statement.
Let’s understand this concept by looking at the following example.
bar([2 6 12 7 4 11 5 9])
output = gcf;
exportgraphics(output,'barchart.png','Resolution',299)
Output:
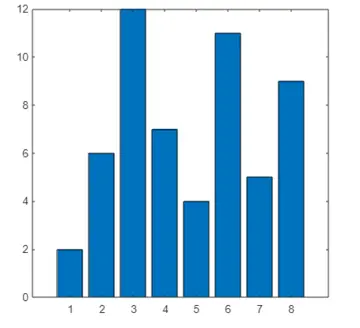
We created a bar graph in this example and saved it as a 299-DPI-PNG file extension. Following this example, you can save any image or graph plot picture of your choice according to the resolution you want.
Use the exportgraphics Function to Change the Image or Figure’s Background Color
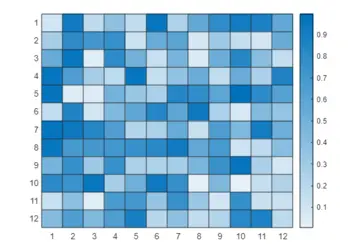
Let us implement this by making a heatmap with transparent background using the exportgraphics function.
op = heatmap(rand(12,12));
exportgraphics(op,'output.pdf','BackgroundColor','none','ContentType','vector')
Output:

Mehak is an electrical engineer, a technical content writer, a team collaborator and a digital marketing enthusiast. She loves sketching and playing table tennis. Nature is what attracts her the most.
LinkedIn