SciPy scipy.interpolate.interp1d Function
-
Syntax of
scipy.interpolate.interp1d()to Interpolate Data Points: -
Example Code :
1d Linear InterpolationBetween Data Points Usingscipy.interpolate.interp1d() -
Example Code : Set
kindParameter inscipy.interpolate.interp1d()Method

Python Scipy scipy.interpolate.interp1d() class is used to interpolate an one-dimensional function. A one-dimensional function takes a single input value as the parameter and returns a single analyzed output value.
Normally, we have a series of data points in discrete locations. Now, we are trying to approximate the function that can find y values for any given x values between these given points.
Syntax of scipy.interpolate.interp1d() to Interpolate Data Points:
scipy.interpolate.interp1d(x, y, kind)
Parameters
x |
Array-like. It is the input set of values provided to the function. |
y |
Array-like. It is the input value defined based on x. |
kind |
It is an optional parameter. It specifies the kind of interpolation. By default, it is set to linear. |
Return
It returns a function.
Example Code : 1d Linear Interpolation Between Data Points Using scipy.interpolate.interp1d()
import numpy as np
import matplotlib.pyplot as plt
import scipy
from scipy import interpolate

x_value = np.array([0, 1, 2, 4])
y_value = np.array([2, 3, 12, 147])

function = scipy.interpolate.interp1d(x_value, y_value)
x_new = np.linspace(0, 4, 10)

plt.scatter(x_value, y_value, color="blue")
plt.plot(x_new, function(x_new), color="black")
plt.xlabel("X-Values")
plt.ylabel("Y-Values")
plt.title("1d Interpolation using scipy interp1d method")
plt.show()
Output:
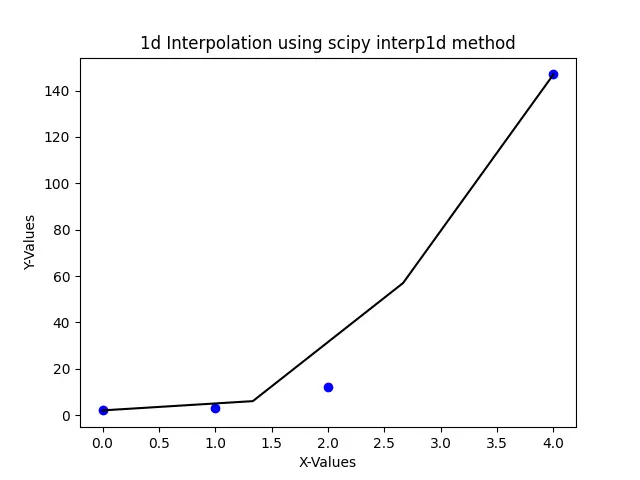
Here, we try to interpolate or create a function approximating the relationship between x_value and y_value. In above code x_value and y_value are taken randomly. Then the values are passed as an argument into the interp1d function, which determines the interpolation function. Now we can find any y_value for any given x_value in the range of x_new.
Finally, to visualize how the interpolation function looks, we take 10 points between 0 and 4 and plot the line curve of the function represented by the black curve in the figure.
Since we have not set what kind of curve we want to interpolate, by default, the interp1d method shows us a linear straight line between points.
Example Code : Set kind Parameter in scipy.interpolate.interp1d() Method
import numpy as np
import matplotlib.pyplot as plt
import scipy
from scipy import interpolate

x_value = np.array([0, 1, 2, 4])
y_value = np.array([2, 3, 12, 147])

f_linear = scipy.interpolate.interp1d(x_value, y_value)
f_quad = scipy.interpolate.interp1d(x_value, y_value, kind="quadratic")
x_new = np.linspace(0, 4, 4)

plt.scatter(x_value, y_value, color="blue")
plt.plot(x_new, f_linear(x_new), color="black")
plt.plot(x_new, f_quad(x_new), color="green")
plt.xlabel("X-Values")
plt.ylabel("Y-Values")
plt.title("1d Interpolation using scipy interp1d method")
plt.legend(["linear", "quadratic", "data"], loc="best")
plt.show()
Output:
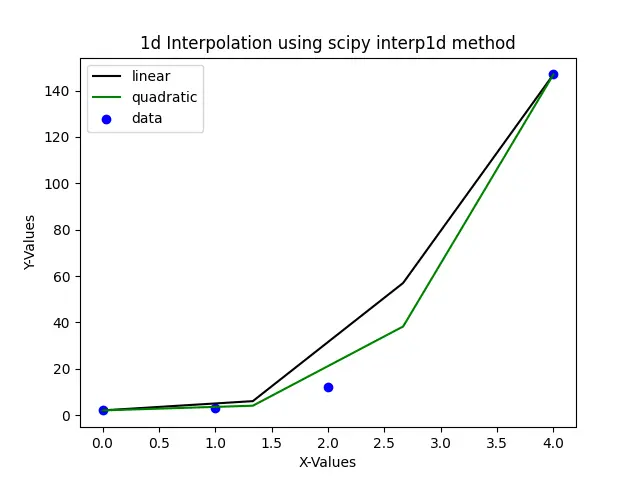
The above plot shows interpolation functions approximated using linear and quadratic techniques. The black line in the plot represents interpolated line using the linear method, and the green line in the plot represents interpolated line using the quadratic method.
Thus to summarize, the interp1d class is used to calculate a function using the provided data points and can be calculated anytime, anywhere specified within the given domain using linear interpolation.

Suraj Joshi is a backend software engineer at Matrice.ai.
LinkedIn