Python Pandas pandas.pivot_table() Function
-
Syntax of
pandas.pivot_table() -
Example Codes:
pandas.pivot_table() -
Example Codes:
pandas.pivot_table()to Specify Multiple Aggregate Function -
Example Codes:
pandas.pivot_table()to Use themarginsParameter
Python Pandas pandas.pivot_table() function avoids the repetition of data of the DataFrame. It summarizes the data and applies different aggregate functions on the data.
Syntax of pandas.pivot_table()
pandas.pivot_table(
    data,
    values=None,
    index=None,
    columns=None,
    aggfunc="mean",
    fill_value=None,
    margins=False,
    dropna=True,
    margins_name="All",
    observed=False,
)
Parameters
This function has several parameters. The default values of all the parameters are mentioned above.
data |
It is the DataFrame from which we want to remove the repeated data. |
values |
It represents the column to aggregate. |
index |
It is a column, grouper, array, or a list. It represents the data column that we want as index i.e as rows. |
columns |
It is a column, grouper, array, or a list. It represents the data column that we want as columns in our output pivot table. |
aggfunc |
It is a function, list of functions, or a dictionary. It represents the aggregate function that will be applied to the data. If a list of aggregate functions is passed then there will be a column for each aggregate function in the resultant table with the column name on the top. |
fill_value |
It is a scalar. It represents the value that will replace the missing values in the output table |
margins |
It is a boolean value. It represents the row and column generated after taking the sum of the respective row and column. |
dropna |
It is a boolean value. It eliminates the columns whose values are NaN from the output table. |
margins_name |
It is a string. It represents the name of the row and column generated if margins value is True. |
observed |
It is a boolean value. If any grouper is categorical then this parameter applies. If it is True, it shows the observed values for categorical groupers. If it is False, it shows all values for categorical groupers |
Return
It returns the summarized DataFrame.
Example Codes: pandas.pivot_table()
Let’s dig deeper into this function by implementing it.
import pandas as pd

dataframe = pd.DataFrame({
                            "Name":
                                ["Olivia",
                                "Olivia",
                                "Olivia",
                                "Olivia",
                                "Meghan",
                                "Meghan",
                                "Meghan",
                                "Meghan"],
                            "Date":
                                ["03-06-2019",
                                "04-06-2019",
                                "03-06-2019",
                                "04-06-2019",
                                "03-06-2019",
                                "04-06-2019",
                                "03-06-2019",
                                "04-06-2019"],
                            "Science Marks":
                                [10,
                                2,
                                4,
                                6,
                                8,
                                9,
                                1,
                                10]
                        })
print(dataframe)
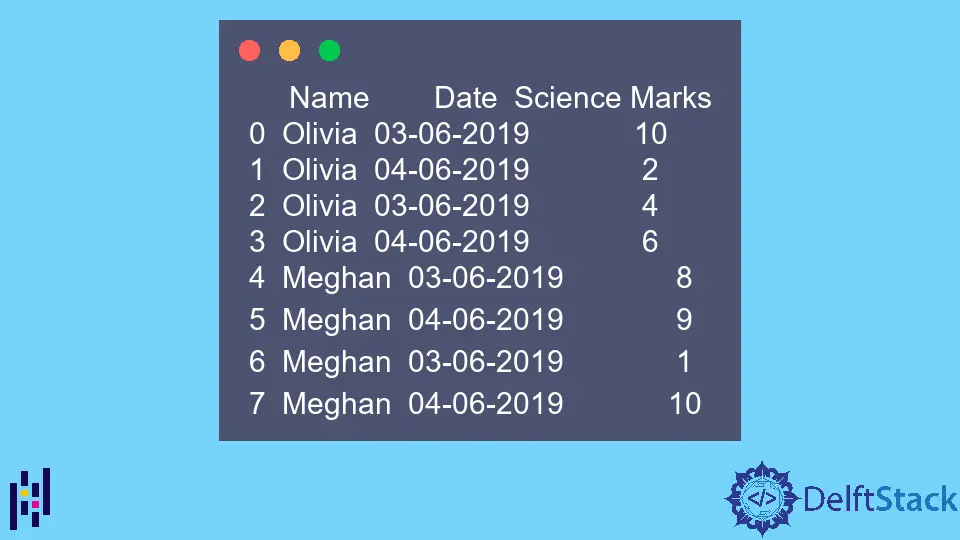
The example DataFrame is,
     Name        Date  Science Marks
0  Olivia  03-06-2019             10
1  Olivia  04-06-2019              2
2  Olivia  03-06-2019              4
3  Olivia  04-06-2019              6
4  Meghan  03-06-2019              8
5  Meghan  04-06-2019              9
6  Meghan  03-06-2019              1
7  Meghan  04-06-2019             10
Note that the above data contains the same value in a column multiple times. This pivot_table function will summarize this data.
import pandas as pd

dataframe = pd.DataFrame(
    {
        "Name": [
            "Olivia",
            "Olivia",
            "Olivia",
            "Olivia",
            "Meghan",
            "Meghan",
            "Meghan",
            "Meghan",
        ],
        "Date": [
            "03-06-2019",
            "04-06-2019",
            "03-06-2019",
            "04-06-2019",
            "03-06-2019",
            "04-06-2019",
            "03-06-2019",
            "04-06-2019",
        ],
        "Science Marks": [10, 2, 4, 6, 8, 9, 1, 10],
    }
)

pivotTable = pd.pivot_table(dataframe, index="Name", columns="Date")
print(pivotTable)
Output:
              Science Marks
Date      03-06-2019 04-06-2019
Name
Meghan           4.5        9.5
Olivia           7.0        4.0
Here, we have chosen the Name column as the index and the Date as the column. The function has generated the result based on the default parameters. The default aggregate function mean() has calculated the mean of the values.
Example Codes: pandas.pivot_table() to Specify Multiple Aggregate Function
import pandas as pd

dataframe = pd.DataFrame(
    {
        "Name": [
            "Olivia",
            "Olivia",
            "Olivia",
            "Olivia",
            "Meghan",
            "Meghan",
            "Meghan",
            "Meghan",
        ],
        "Date": [
            "03-06-2019",
            "04-06-2019",
            "03-06-2019",
            "04-06-2019",
            "03-06-2019",
            "04-06-2019",
            "03-06-2019",
            "04-06-2019",
        ],
        "Science Marks": [10, 2, 4, 6, 8, 9, 1, 10],
    }
)

pivotTable = pd.pivot_table(
    dataframe, index="Name", columns="Date", aggfunc=["sum", "count"]
)
print(pivotTable)
Output:
                   sum                    count
              Science Marks            Science Marks
Date      03-06-2019 04-06-2019    03-06-2019 04-06-2019
Name
Meghan             9         19             2          2
Olivia            14          8             2          2
We have used two aggregate functions. The columns of these functions are generated separately.
Example Codes: pandas.pivot_table() to Use the margins Parameter
import pandas as pd

dataframe = pd.DataFrame(
    {
        "Name": [
            "Olivia",
            "Olivia",
            "Olivia",
            "Olivia",
            "Meghan",
            "Meghan",
            "Meghan",
            "Meghan",
        ],
        "Date": [
            "03-06-2019",
            "04-06-2019",
            "03-06-2019",
            "04-06-2019",
            "03-06-2019",
            "04-06-2019",
            "03-06-2019",
            "04-06-2019",
        ],
        "Science Marks": [10, 2, 4, 6, 8, 9, 1, 10],
    }
)

pivotTable = pd.pivot_table(
    dataframe, index="Name", columns="Date", aggfunc=["sum", "count"], margins=True
)
print(pivotTable)
Output:
                   sum                        count
              Science Marks                Science Marks
Date      03-06-2019 04-06-2019 All    03-06-2019 04-06-2019 All
Name
Meghan             9         19  28             2          2   4
Olivia            14          8  22             2          2   4
All               23         27  50             4          4   8
The margins parameter has generated a new row named All and a new column named also as All which shows the sum of the row and column respectively.