在 Python 中绘制混淆矩阵
- 在 Python 中使用 Matplotlib 绘制混淆矩阵
- 在 Python 中使用 Seaborn 绘制混淆矩阵
- 在 Python 中使用 Pretty Confusion Matrix 绘制混淆矩阵

本文将讨论使用不同的库包在 Python 中绘制混淆矩阵。
在 Python 中使用 Matplotlib 绘制混淆矩阵
这个程序展示了我们如何使用 Matplotlib 绘制混淆矩阵。
下面是我们绘制混淆矩阵所需的两个库包。
from sklearn.metrics import confusion_matrix
import matplotlib.pyplot as plt
导入必要的包后,我们需要根据给定的数据创建混淆矩阵。
首先,我们声明变量 y_true 和 y_pred。y-true 填充实际值,而 y-pred 填充预测值。
y_true = ["bat", "ball", "ball", "bat", "bat", "bat"]
y_pred = ["bat", "bat", "ball", "ball", "bat", "bat"]
然后我们声明一个变量 mat_con 来存储矩阵。下面是我们将用来创建混淆矩阵的语法。
mat_con = confusion_matrix(y_true, y_pred, labels=["bat", "ball"])
它告诉程序用两个参数 y_true 和 y_pred 创建一个混淆矩阵。labels 告诉程序混淆矩阵将由两个输入值组成,bat 和 ball。
要绘制混淆矩阵,我们还需要指出指导程序创建绘图所需的属性。
fig, px = plt.subplots(figsize=(7.5, 7.5))
px.matshow(mat_con, cmap=plt.cm.YlOrRd, alpha=0.5)
plt.subplots() 在系统中创建一个空图 px,而 figsize=(7.5, 7.5) 决定输出窗口的 x 和 y 长度。相等的 x 和 y 值将在完全平方的窗口上显示你的图。
px.matshow 用于在空白图中填充我们的混淆矩阵,而 cmap=plt.cm.YlOrRd 指示程序用黄红色渐变填充列。
alpha=0.5 用于决定渐变的深度或黄色和红色的深浅程度。
然后,我们运行一个嵌套循环,以 2X2 格式绘制我们的混淆矩阵。
for m in range(mat_con.shape[0]):
    for n in range(mat_con.shape[1]):
        px.text(x=m, y=n, s=mat_con[m, n], va="center", ha="center", size="xx-large")
for m in range(mat_con.shape[0]): 为行数运行循环,(shape[0] 代表行数)。for n in range(mat_con.shape[1]): 在现有循环内运行另一个循环以获取存在的列数。
px.text(x=m,y=n,s=mat_con[m, n], va='center', ha='center', size='xx-large') 用行和列的值。
在最后一步中,我们使用 plt.xlabel() 和 plt.ylabel() 来标记坐标轴,并使用语法 plt.title() 放置标题图。
plt.xlabel("Predictions", fontsize=16)
plt.ylabel("Actuals", fontsize=16)
plt.title("Confusion Matrix", fontsize=15)
plt.show()
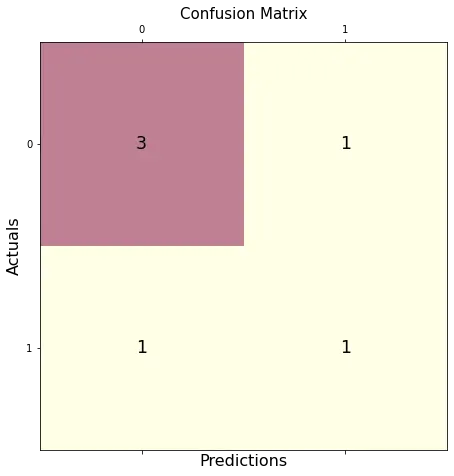
综上所述,我们生成了下面的完整代码。
# imports
from sklearn.metrics import confusion_matrix
import matplotlib.pyplot as plt

# creates confusion matrix
y_true = ["bat", "ball", "ball", "bat", "bat", "bat"]
y_pred = ["bat", "bat", "ball", "ball", "bat", "bat"]
mat_con = confusion_matrix(y_true, y_pred, labels=["bat", "ball"])

# Setting the attributes
fig, px = plt.subplots(figsize=(7.5, 7.5))
px.matshow(mat_con, cmap=plt.cm.YlOrRd, alpha=0.5)
for m in range(mat_con.shape[0]):
    for n in range(mat_con.shape[1]):
        px.text(x=m, y=n, s=mat_con[m, n], va="center", ha="center", size="xx-large")

# Sets the labels
plt.xlabel("Predictions", fontsize=16)
plt.ylabel("Actuals", fontsize=16)
plt.title("Confusion Matrix", fontsize=15)
plt.show()
输出:
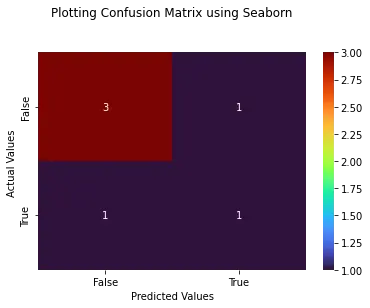
在 Python 中使用 Seaborn 绘制混淆矩阵
使用 Seaborn 允许我们创建外观不同的图,而无需过多关注属性或创建嵌套循环。
下面是绘制我们的混淆矩阵所需的库包。
import seaborn as sebrn
如上一个程序所示,我们将使用 confusion_matrix() 方法创建一个混淆矩阵。
要创建绘图,我们将使用以下语法。
fx = sebrn.heatmap(conf_matrix, annot=True, cmap="turbo")
我们使用了 seaborn 热图。annot=True 用数据填充绘图;一个 False 值将导致一个没有值的图。
cmap='turbo' 代表颜色阴影;我们可以从数十种不同的阴影中选择我们的图。
下面的代码将标记我们的轴并设置标题。
fx.set_title("Plotting Confusion Matrix using Seaborn\n\n")
fx.set_xlabel("\nValues model predicted")
fx.set_ylabel("True Values ")
最后,我们使用以下语法标记这些框。此步骤是可选的,但不使用它会降低矩阵的可见逻辑清晰度。
fx.xaxis.set_ticklabels(["False", "True"])
fx.yaxis.set_ticklabels(["False", "True"])
让我们把所有东西放在一个工作程序中。
# imports
import seaborn as sebrn
from sklearn.metrics import confusion_matrix
import matplotlib.pyplot as atlas

y_true = ["bat", "ball", "ball", "bat", "bat", "bat"]
y_pred = ["bat", "bat", "ball", "ball", "bat", "bat"]
conf_matrix = confusion_matrix(y_true, y_pred, labels=["bat", "ball"])

# Using Seaborn heatmap to create the plot
fx = sebrn.heatmap(conf_matrix, annot=True, cmap="turbo")

# labels the title and x, y axis of plot
fx.set_title("Plotting Confusion Matrix using Seaborn\n\n")
fx.set_xlabel("Predicted Values")
fx.set_ylabel("Actual Values ")

# labels the boxes
fx.xaxis.set_ticklabels(["False", "True"])
fx.yaxis.set_ticklabels(["False", "True"])

atlas.show()
输出:
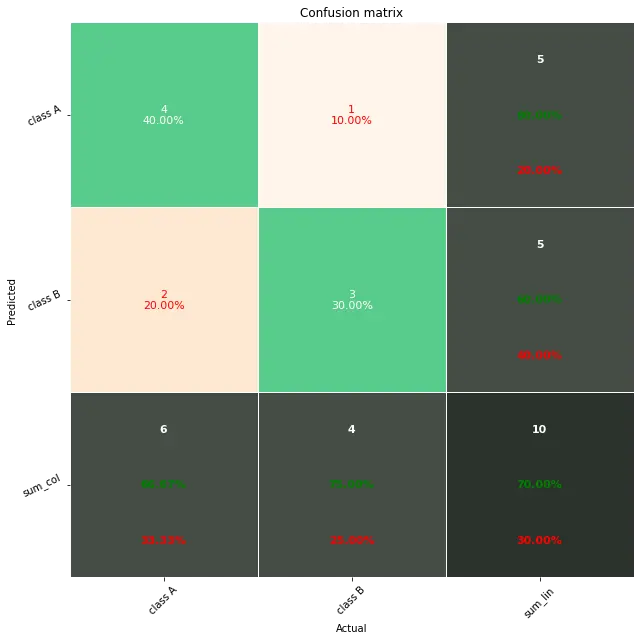
在 Python 中使用 Pretty Confusion Matrix 绘制混淆矩阵
Pretty Confusion Matrix 是一个 Python 库,用于绘制一个令人惊叹的混淆矩阵,其中包含大量与指标相关的数据。在为你的数据集创建高度详细的混淆矩阵时,此 Python 库非常有用。
在下面的程序中,我们使用两组数组绘制了一个混淆矩阵:true_values 和 predicted_values。正如我们所见,通过 Pretty Confusion Matrix 进行绘图比其他绘图库相对简单。
from pretty_confusion_matrix import pp_matrix_from_data

true_values = [1, 0, 0, 1, 0, 0, 1, 0, 0, 1]
predicted_values = [1, 0, 0, 1, 0, 1, 0, 0, 1, 1]

cmap = "PuRd"
pp_matrix_from_data(true_values, predicted_values)
输出: