在 Python 中繪製混淆矩陣
- 在 Python 中使用 Matplotlib 繪製混淆矩陣
- 在 Python 中使用 Seaborn 繪製混淆矩陣
- 在 Python 中使用 Pretty Confusion Matrix 繪製混淆矩陣
本文將討論使用不同的庫包在 Python 中繪製混淆矩陣。
在 Python 中使用 Matplotlib 繪製混淆矩陣
這個程式展示了我們如何使用 Matplotlib 繪製混淆矩陣。
下面是我們繪製混淆矩陣所需的兩個庫包。
from sklearn.metrics import confusion_matrix
import matplotlib.pyplot as plt
匯入必要的包後,我們需要根據給定的資料建立混淆矩陣。
首先,我們宣告變數 y_true 和 y_pred。y-true 填充實際值,而 y-pred 填充預測值。
y_true = ["bat", "ball", "ball", "bat", "bat", "bat"]
y_pred = ["bat", "bat", "ball", "ball", "bat", "bat"]
然後我們宣告一個變數 mat_con 來儲存矩陣。下面是我們將用來建立混淆矩陣的語法。
mat_con = confusion_matrix(y_true, y_pred, labels=["bat", "ball"])
它告訴程式用兩個引數 y_true 和 y_pred 建立一個混淆矩陣。labels 告訴程式混淆矩陣將由兩個輸入值組成,bat 和 ball。
要繪製混淆矩陣,我們還需要指出指導程式建立繪圖所需的屬性。
fig, px = plt.subplots(figsize=(7.5, 7.5))
px.matshow(mat_con, cmap=plt.cm.YlOrRd, alpha=0.5)
plt.subplots() 在系統中建立一個空圖 px,而 figsize=(7.5, 7.5) 決定輸出視窗的 x 和 y 長度。相等的 x 和 y 值將在完全平方的視窗上顯示你的圖。
px.matshow 用於在空白圖中填充我們的混淆矩陣,而 cmap=plt.cm.YlOrRd 指示程式用黃紅色漸變填充列。
alpha=0.5 用於決定漸變的深度或黃色和紅色的深淺程度。
然後,我們執行一個巢狀迴圈,以 2X2 格式繪製我們的混淆矩陣。
for m in range(mat_con.shape[0]):
    for n in range(mat_con.shape[1]):
        px.text(x=m, y=n, s=mat_con[m, n], va="center", ha="center", size="xx-large")
for m in range(mat_con.shape[0]): 為行數執行迴圈,(shape[0] 代表行數)。for n in range(mat_con.shape[1]): 在現有迴圈內執行另一個迴圈以獲取存在的列數。
px.text(x=m,y=n,s=mat_con[m, n], va='center', ha='center', size='xx-large') 用行和列的值。
在最後一步中,我們使用 plt.xlabel() 和 plt.ylabel() 來標記座標軸,並使用語法 plt.title() 放置標題圖。
plt.xlabel("Predictions", fontsize=16)
plt.ylabel("Actuals", fontsize=16)
plt.title("Confusion Matrix", fontsize=15)
plt.show()
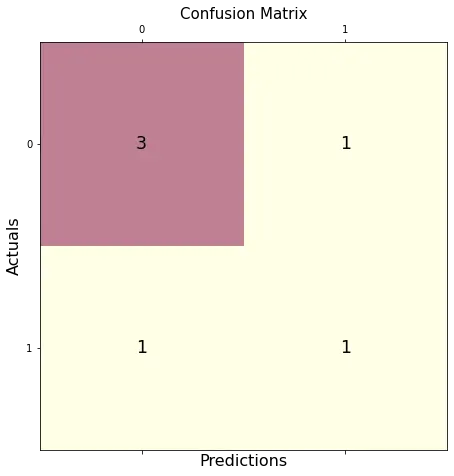
綜上所述,我們生成了下面的完整程式碼。
# imports
from sklearn.metrics import confusion_matrix
import matplotlib.pyplot as plt

# creates confusion matrix
y_true = ["bat", "ball", "ball", "bat", "bat", "bat"]
y_pred = ["bat", "bat", "ball", "ball", "bat", "bat"]
mat_con = confusion_matrix(y_true, y_pred, labels=["bat", "ball"])

# Setting the attributes
fig, px = plt.subplots(figsize=(7.5, 7.5))
px.matshow(mat_con, cmap=plt.cm.YlOrRd, alpha=0.5)
for m in range(mat_con.shape[0]):
    for n in range(mat_con.shape[1]):
        px.text(x=m, y=n, s=mat_con[m, n], va="center", ha="center", size="xx-large")

# Sets the labels
plt.xlabel("Predictions", fontsize=16)
plt.ylabel("Actuals", fontsize=16)
plt.title("Confusion Matrix", fontsize=15)
plt.show()
輸出:
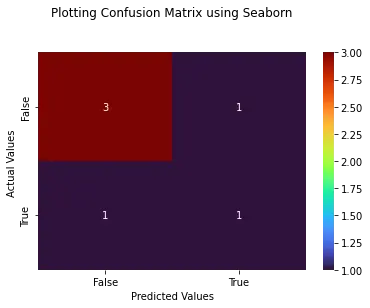
在 Python 中使用 Seaborn 繪製混淆矩陣
使用 Seaborn 允許我們建立外觀不同的圖,而無需過多關注屬性或建立巢狀迴圈。
下面是繪製我們的混淆矩陣所需的庫包。
import seaborn as sebrn
如上一個程式所示,我們將使用 confusion_matrix() 方法建立一個混淆矩陣。
要建立繪圖,我們將使用以下語法。
fx = sebrn.heatmap(conf_matrix, annot=True, cmap="turbo")
我們使用了 seaborn 熱圖。annot=True 用資料填充繪圖;一個 False 值將導致一個沒有值的圖。
cmap='turbo' 代表顏色陰影;我們可以從數十種不同的陰影中選擇我們的圖。
下面的程式碼將標記我們的軸並設定標題。
fx.set_title("Plotting Confusion Matrix using Seaborn\n\n")
fx.set_xlabel("\nValues model predicted")
fx.set_ylabel("True Values ")
最後,我們使用以下語法標記這些框。此步驟是可選的,但不使用它會降低矩陣的可見邏輯清晰度。
fx.xaxis.set_ticklabels(["False", "True"])
fx.yaxis.set_ticklabels(["False", "True"])
讓我們把所有東西放在一個工作程式中。
# imports
import seaborn as sebrn
from sklearn.metrics import confusion_matrix
import matplotlib.pyplot as atlas

y_true = ["bat", "ball", "ball", "bat", "bat", "bat"]
y_pred = ["bat", "bat", "ball", "ball", "bat", "bat"]
conf_matrix = confusion_matrix(y_true, y_pred, labels=["bat", "ball"])

# Using Seaborn heatmap to create the plot
fx = sebrn.heatmap(conf_matrix, annot=True, cmap="turbo")

# labels the title and x, y axis of plot
fx.set_title("Plotting Confusion Matrix using Seaborn\n\n")
fx.set_xlabel("Predicted Values")
fx.set_ylabel("Actual Values ")

# labels the boxes
fx.xaxis.set_ticklabels(["False", "True"])
fx.yaxis.set_ticklabels(["False", "True"])

atlas.show()
輸出:
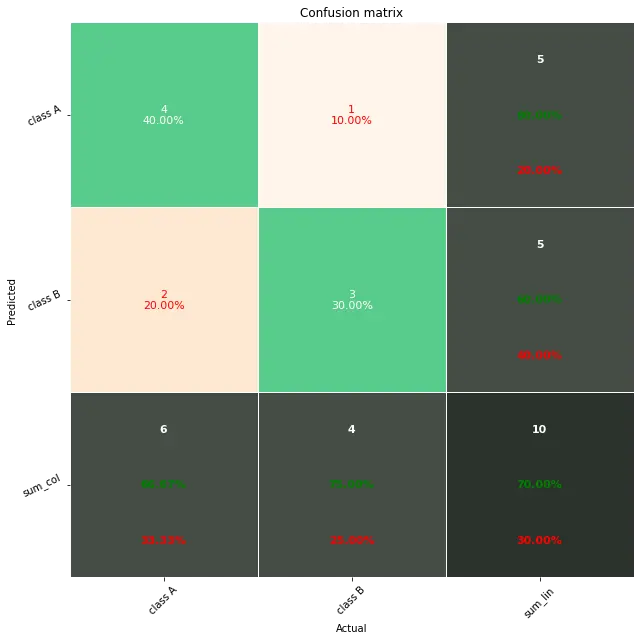
在 Python 中使用 Pretty Confusion Matrix 繪製混淆矩陣
Pretty Confusion Matrix 是一個 Python 庫,用於繪製一個令人驚歎的混淆矩陣,其中包含大量與指標相關的資料。在為你的資料集建立高度詳細的混淆矩陣時,此 Python 庫非常有用。
在下面的程式中,我們使用兩組陣列繪製了一個混淆矩陣:true_values 和 predicted_values。正如我們所見,通過 Pretty Confusion Matrix 進行繪圖比其他繪相簿相對簡單。
from pretty_confusion_matrix import pp_matrix_from_data

true_values = [1, 0, 0, 1, 0, 0, 1, 0, 0, 1]
predicted_values = [1, 0, 0, 1, 0, 1, 0, 0, 1, 1]

cmap = "PuRd"
pp_matrix_from_data(true_values, predicted_values)
輸出: