在 Python Matplotlib 中生成反向色彩图
- 在 Python Matplotlib 中的色彩图(Colormaps)
-
在 Matplotlib Python 中使用
_r进行反向颜色映射 -
在 Matplotlib Python 中使用
matplotlib. colors.Colormap.reversed()反转 Colormap
色彩图 Colormap 是一种将数据值映射到颜色的简单方法。反转颜色图意味着反转每个值的色彩图。假设我们有一个色彩图,其中较低的值被映射到黄色,较高的值被映射到红色。通过反转 colormap,较低的值现在被映射到红色,较高的值被映射到黄色。本教程解释了在 Python Matplotlib 中反转色彩图的各种方法。
在 Python Matplotlib 中的色彩图(Colormaps)
import numpy as np
import matplotlib.pyplot as plt

x = np.arange(9)
y = [9, 2, 8, 4, 5, 7, 6, 8, 7]

plt.scatter(x, y, c=y, cmap="viridis")
plt.xlabel("X")
plt.ylabel("Y")
plt.title("Scatter Plot with Virdis colormap")
plt.colorbar()
plt.show()
输出:
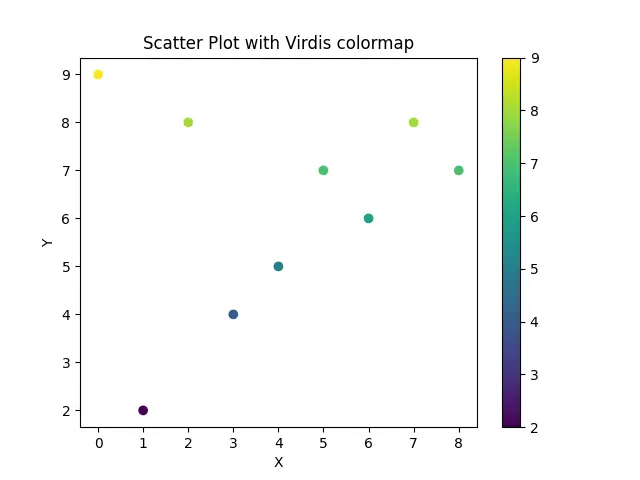
它创建了一个散点图,其 y 值被映射到 viridis colormap。这意味着 y 值较低的点将呈现深蓝色,y 值较高的点将呈现黄色,而中间的点将呈现蓝色和绿色。
我们还可以在图的右侧看到一个颜色条,它显示了 y 不同值的颜色映射。
在 Matplotlib Python 中使用 _r 进行反向颜色映射
在 Matplotlib 中,我们可以通过在 colormap 名称的末尾添加 _r 来反转 colormap,例如 cmap='viridis_r'将简单地反转 viridis colormap。
import numpy as np
import matplotlib.pyplot as plt

x = np.arange(9)
y = [9, 2, 8, 4, 5, 7, 6, 8, 7]

plt.scatter(x, y, c=y, cmap="viridis_r")
plt.xlabel("X")
plt.ylabel("Y")
plt.title("Scatter Plot with Inverse Virdis colormap")
plt.colorbar()
plt.show()
输出:
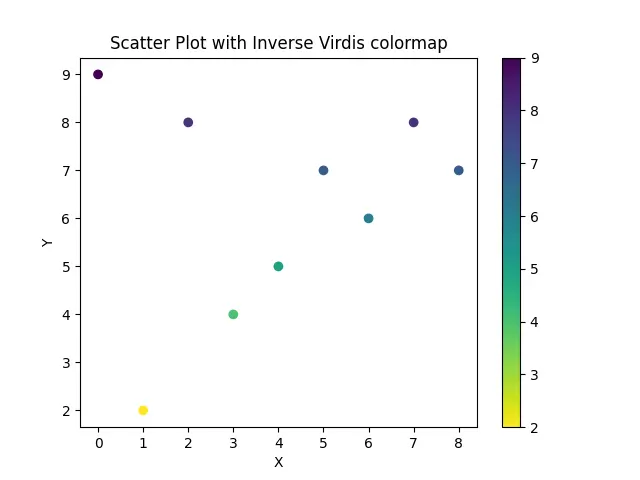
它创建了一个散点图,其 y 值被映射到反转的 viridis colormap 上。因此,图中数值较高的点得到深蓝色,数值较低的点得到黄色。
我们还可以看到,在这个例子中,右边的颜色条已经反转了颜色。
在 Matplotlib Python 中使用 matplotlib. colors.Colormap.reversed() 反转 Colormap
另一种在 Python 中反转 Colormap 的方法是使用 matplotlib.color.Colormap.reversed() 方法来创建反转的 Colormap。
import numpy as np
import matplotlib.pyplot as plt
from matplotlib import cm

x = np.arange(9)
y = [9, 2, 8, 4, 5, 7, 6, 8, 7]

initial_cmap = cm.get_cmap("viridis")
reversed_cmap = initial_cmap.reversed()

plt.scatter(x, y, c=y, cmap=reversed_cmap)
plt.xlabel("X")
plt.ylabel("Y")
plt.title("Scatter Plot with Inverse Virdis colormap")
plt.colorbar()
plt.show()
输出:

它还创建了一个散点图,其 y 值被映射到反向的 viridis colormap 上。reversed() 方法将应用该方法的 colormap 对象反转。
import numpy as np
import matplotlib.pyplot as plt
from matplotlib import cm
from matplotlib.colors import ListedColormap

x = np.arange(9)
y = [9, 2, 8, 4, 5, 7, 6, 8, 7]

initial_cmap = cm.get_cmap("viridis")
reversed_cmap = ListedColormap(initial_cmap.colors[::-1])

plt.scatter(x, y, c=y, cmap=reversed_cmap)
plt.xlabel("X")
plt.ylabel("Y")
plt.title("Scatter Plot with Inverse Virdis colormap")
plt.colorbar()
plt.show()
输出:

它还创建了一个散点图,其 y 值被映射到反转的 viridis colormap 上。任何 colormap 都只是一个颜色列表。我们可以使用 cmap. colors 访问 colormap cmap 的颜色列表。然后我们将列表反转,最后使用 matplotlib.cols 包中的 ListedColormap() 函数将反转后的列表转换回颜色图。

Suraj Joshi is a backend software engineer at Matrice.ai.
LinkedIn