Matplotlib 中为直方图着色
Maxim Maeder
2024年2月15日
Matplotlib
Matplotlib Histogram

本教程教你如何为 matplotlib 直方图着色并解决条形显示为黑色的问题。
在我们为直方图着色之前,我们需要设置我们的脚本以使用该库。所以我们从导入 matplotlib 开始。此外,我们从 random 模块加载 randrange 函数来快速生成一些数据。
import matplotlib.pyplot as plt
from random import randrange
我们继续设置样式,查看所有可用的样式查看 plt.style.available。
plt.style.use("classic")
最后但同样重要的是,我们在单行循环中生成数据。这不会生成有意义的好数据,但它有利于测试目的。请记住,你的数据不会相同。
data = [randrange(0, 100) for _ in range(0, 800)]
在 Matplotlib 中为直方图着色
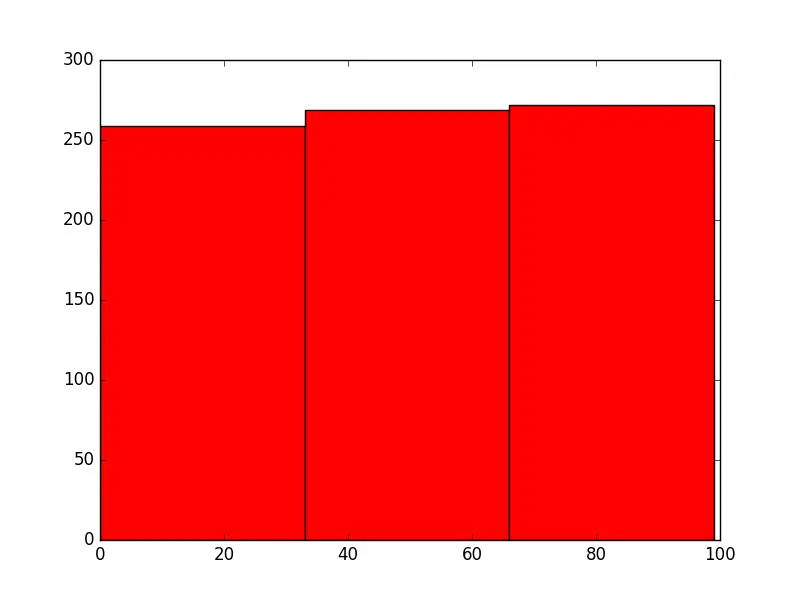
现在我们制作一个彩色直方图。我们只是传递给 color 参数一个颜色名称来执行此操作。此处列出了 matplotlib 中可用的所有命名颜色。不要忘记调用show() 函数。
plt.hist(data, 3, color="red")
plt.show()
可能的结果:
当我们设置更高数量的 bin 时,就会出现问题。正如你在图像中看到的,颜色不再是红色而是黑色。

这是因为我们使用的样式将条的边框颜色设置为黑色,现在我们看到的只有它。为了解决这个问题,我们要么将条形边框宽度设置为 0,要么将其颜色也设置为红色。
plt.hist(data, 500, color="red", ec="red")
# ec is the edge color
或者,
plt.hist(data, 500, color="red", lw=0)
# lw is the linewidth
完整代码:
import matplotlib.pyplot as plt
from random import randrange

plt.style.use("classic")

data = [randrange(0, 100) for _ in range(0, 800)]

plt.hist(data, 500, color="red", lw=0)

plt.show()
Enjoying our tutorials? Subscribe to DelftStack on YouTube to support us in creating more high-quality video guides. Subscribe
作者: Maxim Maeder

Hi, my name is Maxim Maeder, I am a young programming enthusiast looking to have fun coding and teaching you some things about programming.
GitHub