如何使用 Matplotlib 实时绘制数据
为了使用 Matplotlib 实时绘制数据或在 Matplotlib 中制作动画,我们不断地通过循环迭代然后绘制更新后的值来更新要绘制的变量。为了通过动画实时查看更新的绘图,我们使用了各种方法,例如 FuncAnimation() 函数,canvas.draw() 和 canvas_flush_events()。
FuncAnimation() 函数
我们可以通过更新变量 x 和 y 然后使用 matplotlib.animation.FuncAnimation 通过动画显示更新来实时更新图。
语法:
matplotlib.animation.FuncAnimation(fig,
                                   func,
                                   frames=None,
                                   init_func=None,
                                   fargs=None,
                                   save_count=None,
                                   *,
                                   cache_frame_data=True,
                                   **kwargs)
代码:
import numpy as np
import matplotlib.pyplot as plt
from matplotlib.animation import FuncAnimation

x = []
y = []

figure, ax = plt.subplots(figsize=(4, 3))
(line,) = ax.plot(x, y)
plt.axis([0, 4 * np.pi, -1, 1])


def func_animate(i):
    x = np.linspace(0, 4 * np.pi, 1000)
    y = np.sin(2 * (x - 0.1 * i))

    line.set_data(x, y)

    return (line,)


ani = FuncAnimation(figure, func_animate, frames=10, interval=50)

ani.save(r"animation.gif", fps=10)

plt.show()
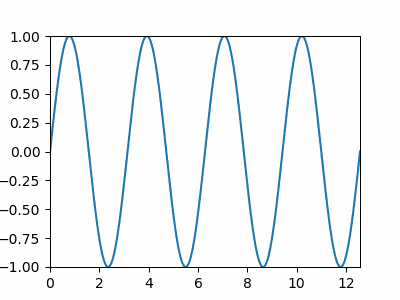
ani = FuncAnimation(figure, func_animate, frames=10, interval=50)
figure 是图形对象,其图将被更新。
func_animate 是在每一帧都要调用的函数。它的第一个参数来自下一个值 frames。
frames=10 等于 range(10)。每帧将 0 到 9 的值传递给 func_animate。我们还可以为 interframe 分配一个帧,例如列表 [0, 1, 3, 7, 12]。
间隔是指以毫秒为单位的帧之间的延迟。
ani.save("animation.gif", fps=10)
我们可以使用诸如 fps 和 dpi 之类的参数将动画保存为 gif 或 mp4。
canvas.draw() 和 canvas_flush_events()
我们可以通过使用 set_xdata() 和 set_ydata() 更新变量 x 和 y 来实时更新绘图,然后使用 canvas.draw() 通过动画显示更新,它是 JavaScript 的方法。
import numpy as np
import time
import matplotlib.pyplot as plt

x = np.linspace(0, 10, 100)
y = np.cos(x)

plt.ion()

figure, ax = plt.subplots(figsize=(8, 6))
(line1,) = ax.plot(x, y)

plt.title("Dynamic Plot of sinx", fontsize=25)

plt.xlabel("X", fontsize=18)
plt.ylabel("sinX", fontsize=18)

for p in range(100):
    updated_y = np.cos(x - 0.05 * p)

    line1.set_xdata(x)
    line1.set_ydata(updated_y)

    figure.canvas.draw()

    figure.canvas.flush_events()
    time.sleep(0.1)
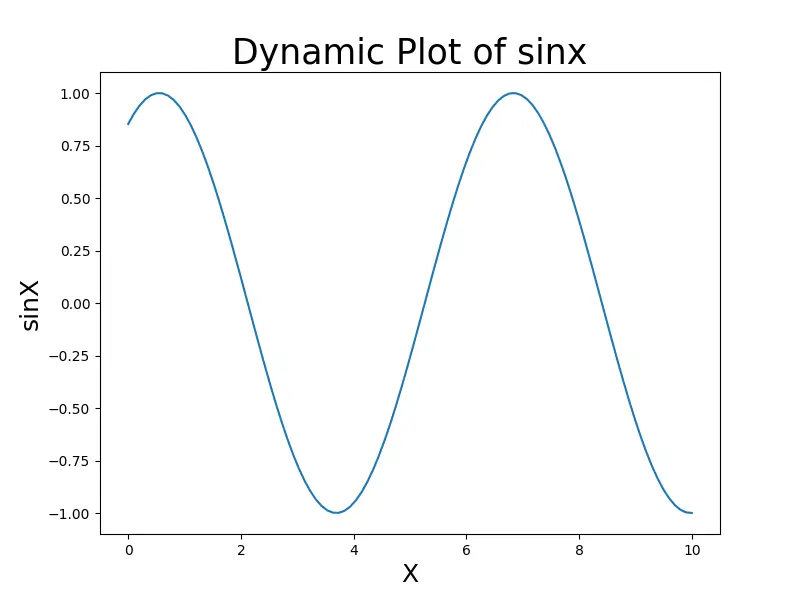
在这里,x 和 y 的值被重复更新,并且图也被实时更新。
plt.ion() 打开交互模式。如果未调用该图,则不会更新。
canvas.flush_events() 是一种基于 JavaScript 的方法,用于在每次迭代时清除图形,以使后续图形不会重叠。
Matplotlib 实时散点图
但是,要画实时分散图,我们只需更新 x 和 y 的值并在每次迭代中添加分散点即可。在这种情况下,我们不需要清除每个图形,因为散点图通常表示平面中的一个不同点,并且这些点几乎没有重叠的机会。
import numpy as np
import matplotlib.pyplot as plt

x = 0
for i in range(100):
    x = x + 0.04
    y = np.sin(x)
    plt.scatter(x, y)
    plt.title("Real Time plot")
    plt.xlabel("x")
    plt.ylabel("sinx")
    plt.pause(0.05)

plt.show()


Suraj Joshi is a backend software engineer at Matrice.ai.
LinkedIn