Matplotlib を使用してデータをリアルタイムでプロットする方法
Matplotlib を使用してリアルタイムでデータをプロットしたり、Matplotlib でアニメーションを作成したりするために、ループで反復してプロットする変数を常に更新し、更新した値をプロットします。更新されたプロットをアニメーションでリアルタイムに表示します。には、FuncAnimation() 関数、canvas.draw()、canvas_flush_events() などのさまざまなメソッドを使用します。
FuncAnimation() 関数
変数 x と y を更新し、matplotlib.animation.FuncAnimation を使用してアニメーションを通じて更新を表示します。ことで、プロットをリアルタイムで更新できます。
構文:
matplotlib.animation.FuncAnimation(fig,
                                   func,
                                   frames=None,
                                   init_func=None,
                                   fargs=None,
                                   save_count=None,
                                   *,
                                   cache_frame_data=True,
                                   **kwargs)
コード:
import numpy as np
import matplotlib.pyplot as plt
from matplotlib.animation import FuncAnimation

x = []
y = []

figure, ax = plt.subplots(figsize=(4, 3))
(line,) = ax.plot(x, y)
plt.axis([0, 4 * np.pi, -1, 1])


def func_animate(i):
    x = np.linspace(0, 4 * np.pi, 1000)
    y = np.sin(2 * (x - 0.1 * i))

    line.set_data(x, y)

    return (line,)


ani = FuncAnimation(figure, func_animate, frames=10, interval=50)

ani.save(r"animation.gif", fps=10)

plt.show()
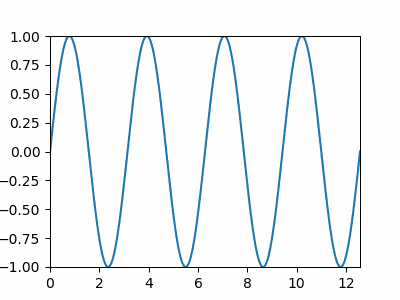
ani = FuncAnimation(figure, func_animate, frames=10, interval=50)
figure は、プロットが更新される Figure オブジェクトです。
func_animate は各フレームで呼び出される関数です。その最初の引数は、次の値 frames から取得されます。
frames=10 は range(10) と同じです。各フレームで 0 から 9 の値が func_animate に渡されます。リスト [0, 1, 3, 7, 12] のように、interalbe を frames に割り当てることもできます。
interval はフレーム間の遅延で、ms の単位です。
ani.save("animation.gif", fps=10)
fps や dpi などのパラメーターを使用して、アニメーションを gif または mp4 に保存できます。
canvas.draw() と canvas_flush_events()
変数 x と y を set_xdata() と set_ydata() で更新し、次に canvas.draw() を使用してアニメーションを通じて更新を表示します。ことで、プロットをリアルタイムで更新できます。JavaScript に基づくメソッド。
import numpy as np
import time
import matplotlib.pyplot as plt

x = np.linspace(0, 10, 100)
y = np.cos(x)

plt.ion()

figure, ax = plt.subplots(figsize=(8, 6))
(line1,) = ax.plot(x, y)

plt.title("Dynamic Plot of sinx", fontsize=25)

plt.xlabel("X", fontsize=18)
plt.ylabel("sinX", fontsize=18)

for p in range(100):
    updated_y = np.cos(x - 0.05 * p)

    line1.set_xdata(x)
    line1.set_ydata(updated_y)

    figure.canvas.draw()

    figure.canvas.flush_events()
    time.sleep(0.1)
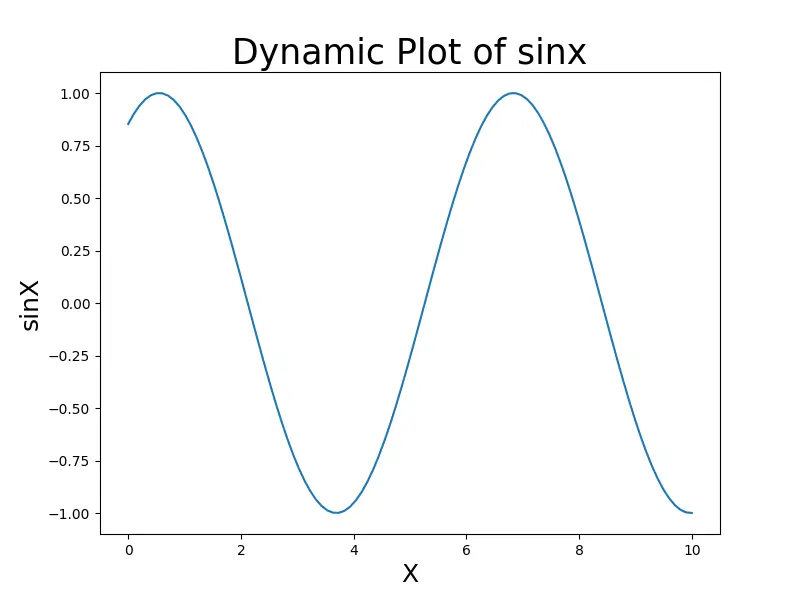
ここで、x と y の値は繰り返し更新され、プロットもリアルタイムで更新されます。
plt.ion() はインタラクティブモードをオンにします。呼び出されない場合、プロットは更新されません。
canvas.flush_events() は JavaScript に基づくメソッドであり、連続する数値が重複しないように、すべての反復で数値をクリアします。
リアルタイム散布図
ただし、リアルタイムの散布を行うには、x と y の値を更新し、各反復で散布点を追加します。この場合、散布図は一般に平面内の明確なポイントを表し、ポイントが重複する可能性はほとんどないため、すべての図をクリアする必要はありません。
import numpy as np
import matplotlib.pyplot as plt

x = 0
for i in range(100):
    x = x + 0.04
    y = np.sin(x)
    plt.scatter(x, y)
    plt.title("Real Time plot")
    plt.xlabel("x")
    plt.ylabel("sinx")
    plt.pause(0.05)

plt.show()


Suraj Joshi is a backend software engineer at Matrice.ai.
LinkedIn