Matplotlib 中如何将图例放置在绘图之外
Jinku Hu
2023年1月30日
Matplotlib
Matplotlib Legend

图例可以通过使用 bbox_to_anchor 放置在 Matplotlib 中的绘图之外。bbox 表示容纳图例的边界框 - bounding box。
plt.legend(bbox_to_anchor=(1.05, 1))
它将图例放置在坐标轴上的位置 (1.05, 1) 处。(0, 0) 是轴坐标的左下角,而 (1.0, 1.0) 是轴坐标的右上角。
图例边界框的实际大小和位置由 plt.legend 中的 bbox_to_anchor 和 loc 的 4 元组参数定义。
plt.legend(bbox_to_anchor=(x0, y0, width, height), loc=)
width 和 height 是图例框的宽度和高度,而 (x0, y0) 是边界框 loc 的坐标。
loc 的值可以是具有以下关系的数字或字符串,
loc 编号 |
loc 字符串 |
|---|---|
| 0 | best |
| 1 | upper right |
| 2 | upper left |
| 3 | lower left |
| 4 | lower right |
| 5 | right |
| 6 | center left |
| 7 | center right |
| 8 | lower center |
| 9 | upper center |
| 10 | center |
plt.legend(bbox_to_anchor=(1.05, 1.0, 0.3, 0.2), loc="upper left")
上面的代码意味着图例框位于坐标为 (1.05, 1.0) 的坐标轴上,宽度为 0.3,高度为 0.2,其中 (1.05, 1.0) 是上坐标图例边框的左上角。
bbox_to_anchor 示例
import matplotlib.pyplot as plt
import numpy as np

x = np.linspace(0, 10, 100)

plt.plot(x, np.sin(x), label="sin(x)")
plt.plot(x, np.cos(x), label="cos(x)")

plt.legend(bbox_to_anchor=(1.05, 1.0), loc="upper left")
plt.tight_layout()
plt.show()
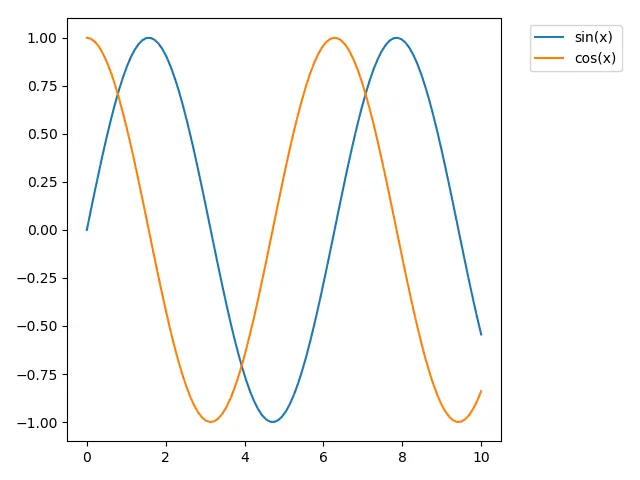
plt.tight_layout() 使子图合适的跟图形匹配。
如果未调用 tight_layout(),则图例框将被裁剪。
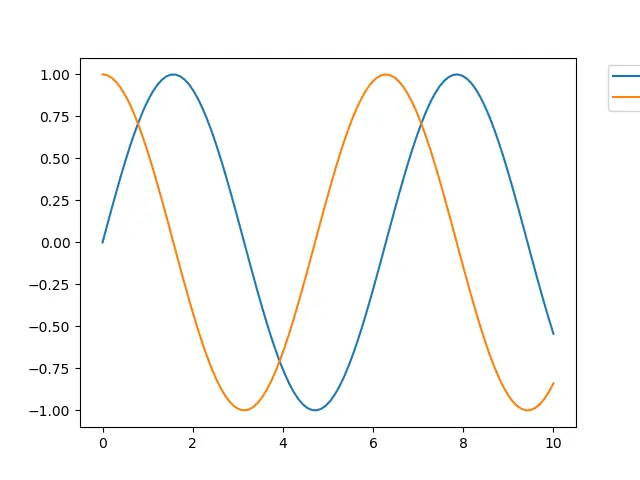
bbox_extra_artists 和 bbox_inches 以防止图例框被裁剪
import matplotlib.pyplot as plt
import numpy as np

x = np.linspace(0, 10, 100)

plt.plot(x, np.sin(x), label="sin(x)")
plt.plot(x, np.cos(x), label="cos(x)")

lg = plt.legend(bbox_to_anchor=(1.05, 1.0), loc="upper left")

plt.savefig(
    "example.png", dpi=300, format="png", bbox_extra_artists=(lg,), bbox_inches="tight"
)
bbox_extra_artists 指定 Artist 的列表,该列表在计算紧凑 bbox 时会考虑在内。
如果将 bbox_inches 设置为 tight,它将计算出图中的紧凑型 bbox。
Enjoying our tutorials? Subscribe to DelftStack on YouTube to support us in creating more high-quality video guides. Subscribe
作者: Jinku Hu
