更改 Seaborn 圖中圖例的位置
Manav Narula
2021年7月16日
Seaborn
Seaborn Legend

在本教程中,我們將學習如何在 Python 中更改 seaborn 圖中的圖例位置。
為此,我們需要禁用預設圖例。這可以通過在 plot 函式中將 legend 引數設定為 False 來完成。我們將使用 matplotlib 庫中的 matplotlib.pyplot.legend() 函式顯式新增圖例。
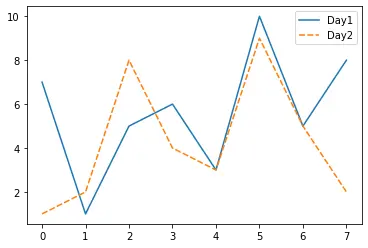
要更改圖例的位置,我們將使用此函式中的 loc 引數。我們可以指定圖例所需的位置作為該引數的值。
例如,
import pandas as pd
import matplotlib.pyplot as plt
import seaborn as sns

df = pd.DataFrame(
    {"Day 1": [7, 1, 5, 6, 3, 10, 5, 8], "Day 2": [1, 2, 8, 4, 3, 9, 5, 2]}
)

sns.lineplot(data=df, legend=False)
plt.legend(labels=["Day1", "Day2"], loc="upper right")
我們還可以指定不同的數字作為此引數的值。不同的數字對應不同的位置。比如 1 代表右上位置,2 代表左上位置等。參考這篇 Matplotlib 文章得到數字與位置關係表。
預設情況下,loc 引數的值為 0,這意味著它會搜尋圖中的位置,以便發生最小重疊。
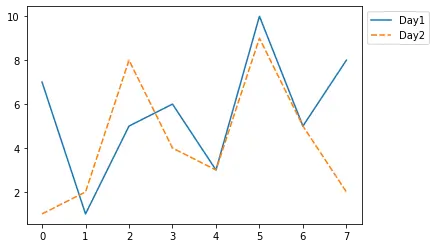
我們還可以使用 bbox_to_anchor 引數將圖例框放置在圖外。bbox_to_anchor 指定圖例相對於 loc 引數中指定位置的位置。如果我們使用二元元組設定 bbox_to_anchor 引數,那麼它會將它們的值視為沿指定 loc 定位的 x 和 y 值。
例如,
import seaborn as sns
import pandas as pd
import matplotlib.pyplot as plt

df = pd.DataFrame(
    {"Day 1": [7, 1, 5, 6, 3, 10, 5, 8], "Day 2": [1, 2, 8, 4, 3, 9, 5, 2]}
)

sns.lineplot(data=df, legend=False)
plt.legend(labels=["Day1", "Day2"], loc=2, bbox_to_anchor=(1, 1))
Enjoying our tutorials? Subscribe to DelftStack on YouTube to support us in creating more high-quality video guides. Subscribe
作者: Manav Narula

Manav is a IT Professional who has a lot of experience as a core developer in many live projects. He is an avid learner who enjoys learning new things and sharing his findings whenever possible.
LinkedIn