HOWTO · Pandas
Pandas 相關矩陣
在本教程中,我們將解釋如何使用 Matplotlib 模組的 DataFrame.corr()方法生成相關矩陣,並使用 pyplot.matshow()方法視覺化相關矩陣。
本頁內容
本教程將解釋我們如何使用 DataFrame.corr() 方法生成相關矩陣,並使用 Matplotlib 中的 pyplot.matshow() 方法將相關矩陣視覺化。
import pandas as pd

employees_df = pd.DataFrame(
    {
        "Name": ["Jonathan", "Will", "Michael", "Liva", "Sia", "Alice"],
        "Age": [20, 22, 29, 20, 20, 21],
        "Weight(KG)": [65, 75, 80, 60, 63, 70],
        "Height(meters)": [1.6, 1.7, 1.85, 1.69, 1.8, 1.75],
        "Salary($)": [3200, 3500, 4000, 2090, 2500, 3600],
    }
)

print(employees_df, "\n")
輸出:
       Name  Age  Weight(KG)  Height(meters)  Salary($)
0  Jonathan   20          65            1.60       3200
1      Will   22          75            1.70       3500
2   Michael   29          80            1.85       4000
3      Liva   20          60            1.69       2090
4       Sia   20          63            1.80       2500
5     Alice   21          70            1.75       3600
我們將使用 DataFrame employees_df 來解釋如何生成和視覺化相關矩陣。
使用 DataFrame.corr() 方法生成相關矩陣
import pandas as pd

employees_df = pd.DataFrame(
    {
        "Name": ["Jonathan", "Will", "Michael", "Liva", "Sia", "Alice"],
        "Age": [20, 22, 29, 20, 20, 21],
        "Weight(KG)": [65, 75, 80, 60, 63, 70],
        "Height(meters)": [1.6, 1.7, 1.85, 1.69, 1.8, 1.75],
        "Salary($)": [3200, 3500, 4000, 2090, 2500, 3600],
    }
)

print("The DataFrame of Employees is:")
print(employees_df, "\n")

corr_df = employees_df.corr()
print("The correlation DataFrame is:")
print(corr_df, "\n")
輸出:
The DataFrame of Employees is:
       Name  Age  Weight(KG)  Height(meters)  Salary($)
0  Jonathan   20          65            1.60       3200
1      Will   22          75            1.70       3500
2   Michael   29          80            1.85       4000
3      Liva   20          60            1.69       2090
4       Sia   20          63            1.80       2500
5     Alice   21          70            1.75       3600

The correlation DataFrame is:
                     Age  Weight(KG)  Height(meters)  Salary($)
Age             1.000000    0.848959        0.655252   0.695206
Weight(KG)      0.848959    1.000000        0.480998   0.914861
Height(meters)  0.655252    0.480998        1.000000   0.285423
Salary($)       0.695206    0.914861        0.285423   1.000000
它生成一個 DataFrame,其中包含 DataFrame 中每一列與其他列之間的相關值。
相關值只在有數值的列之間計算。預設情況下,corr() 方法使用 Pearson 方法來計算相關係數。我們也可以通過在 corr 方法中指定 method 引數的值,使用其他方法如 Kendall 和 spearman 來計算相關係數。
使用 Matplotlib.pyplot.matshow() 方法視覺化 Pandas 相關矩陣
import pandas as pd
import matplotlib.pyplot as plt

employees_df = pd.DataFrame(
    {
        "Name": ["Jonathan", "Will", "Michael", "Liva", "Sia", "Alice"],
        "Age": [20, 22, 29, 20, 20, 21],
        "Weight(KG)": [65, 75, 80, 60, 63, 70],
        "Height(meters)": [1.6, 1.7, 1.85, 1.69, 1.8, 1.75],
        "Salary($)": [3200, 3500, 4000, 2090, 2500, 3600],
    }
)

corr_df = employees_df.corr(method="pearson")

plt.matshow(corr_df)
plt.show()
輸出:
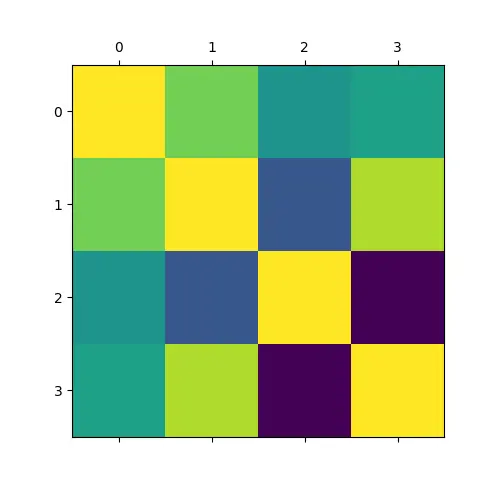
它使用 Matplotlib.pyplot 中的 matshow() 函式繪製從 employees_df DataFrame 生成的相關矩陣。
使用 seaborn.heatmap() 方法視覺化 Pandas 相關矩陣
import pandas as pd
import seaborn as sns
import matplotlib.pyplot as plt

employees_df = pd.DataFrame(
    {
        "Name": ["Jonathan", "Will", "Michael", "Liva", "Sia", "Alice"],
        "Age": [20, 22, 29, 20, 20, 21],
        "Weight(KG)": [65, 75, 80, 60, 63, 70],
        "Height(meters)": [1.6, 1.7, 1.85, 1.69, 1.8, 1.75],
        "Salary($)": [3200, 3500, 4000, 2090, 2500, 3600],
    }
)

corr_df = employees_df.corr(method="pearson")

plt.figure(figsize=(8, 6))
sns.heatmap(corr_df, annot=True)
plt.show()
輸出:
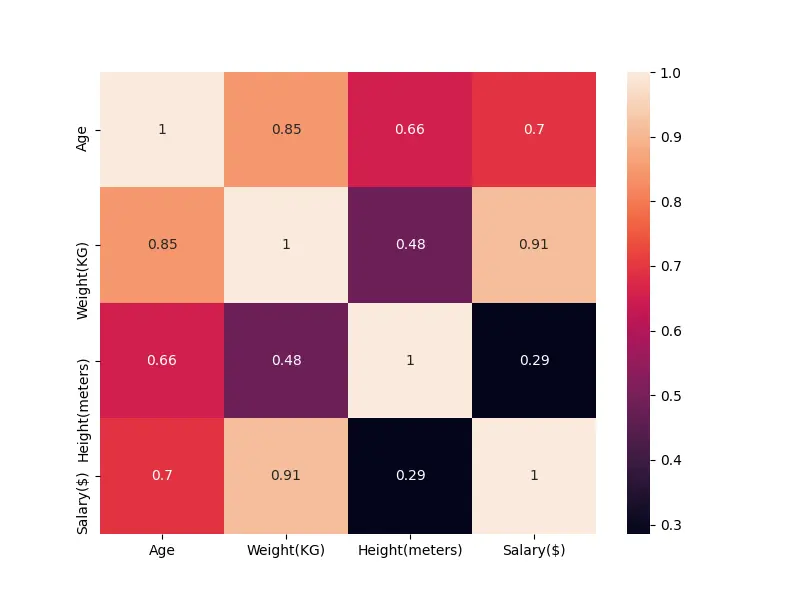
它使用 seaborn 包中的 heatmap() 函式繪製從 employees_df DataFrame 生成的相關矩陣。
使用 DataFrame.style 屬性視覺化相關矩陣
import pandas as pd

employees_df = pd.DataFrame(
    {
        "Name": ["Jonathan", "Will", "Michael", "Liva", "Sia", "Alice"],
        "Age": [20, 22, 29, 20, 20, 21],
        "Weight(KG)": [65, 75, 80, 60, 63, 70],
        "Height(meters)": [1.6, 1.7, 1.85, 1.69, 1.8, 1.75],
        "Salary($)": [3200, 3500, 4000, 2090, 2500, 3600],
    }
)

corr_df = employees_df.corr(method="pearson")

corr_df.style.background_gradient(cmap="coolwarm")
輸出:
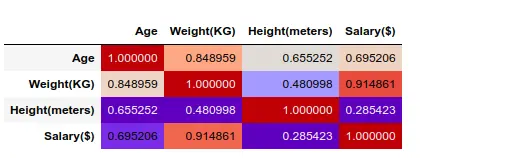
corr_df DataFrame 物件的 style 屬性返回一個 Styler 物件。我們可以使用 Styler 物件的 background_gradient 來視覺化 DataFrame 物件。
本方法只能在 IPython 中生成圖形。