HOWTO · Matplotlib
如何在 Matplotlib 中刪除圖例
我們可以使用 get_legend().remove()和 set_visible()方法從 Matplotlib 中的圖形中刪除圖例。我們還可以通過在 plot()方法中將圖例設定為_nolegend_,將 axis.legend 設定為 None 以及將 fig.legends 設定為空列表,來從 Matplotlib 中的圖中刪除圖例。
本頁內容
我們可以使用圖例物件的 remove() 和 set_visible() 方法從 Matplotlib 中的圖形中刪除圖例。我們還可以通過以下方式從 Matplotlib 中的圖形中刪除圖例:將 plot() 方法中的 label 設定為 _nolegend_,將 axes.legend 設定為 None 以及將 figure.legends 設定為空列表。
matplotlib.axes.Axes.get_legend().remove()
我們可以使用 matplotlib.axes.Axes.get_legend().remove() 方法從 Matplotlib 中的圖形中刪除圖例。
import numpy as np
import matplotlib.pyplot as plt

x = np.linspace(-3, 3, 100)
y1 = np.exp(x)
y2 = 3 * x + 2

fig, ax = plt.subplots(figsize=(8, 6))

ax.plot(x, y1, c="r", label="expoential")
ax.plot(x, y2, c="g", label="Straight line")

leg = plt.legend()

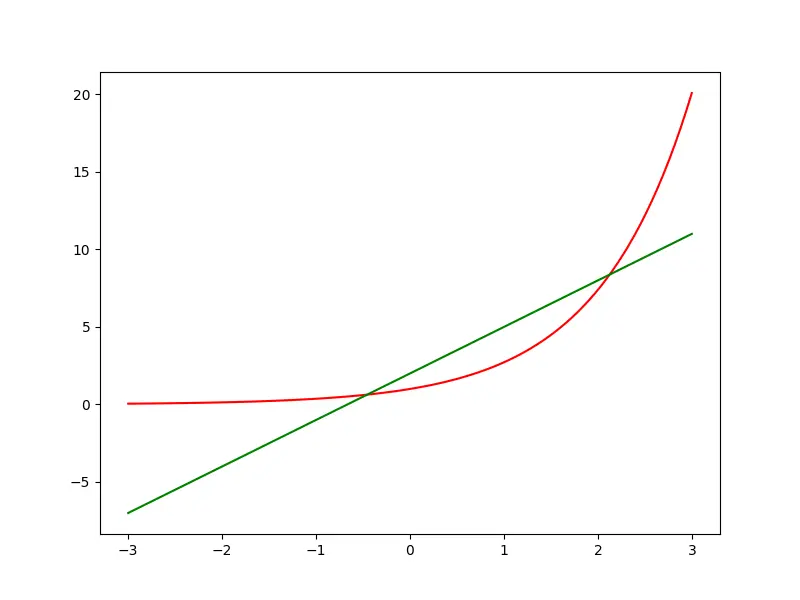
ax.get_legend().remove()

plt.show()
輸出:
matplotlib.axes.Axes.get_legend().set_visible()
如果我們將 False 作為引數傳遞給 matplotlib.axes.Axes.get_legend().set_visible() 方法,則可以從 Matplotlib 中的圖形中刪除圖例。
import numpy as np
import matplotlib.pyplot as plt

x = np.linspace(-3, 3, 100)
y1 = np.exp(x)
y2 = 3 * x + 2

fig, ax = plt.subplots(figsize=(8, 6))

ax.plot(x, y1, c="r", label="expoential")
ax.plot(x, y2, c="g", label="Straight line")

leg = plt.legend()

ax.get_legend().set_visible(False)

plt.show()
輸出:
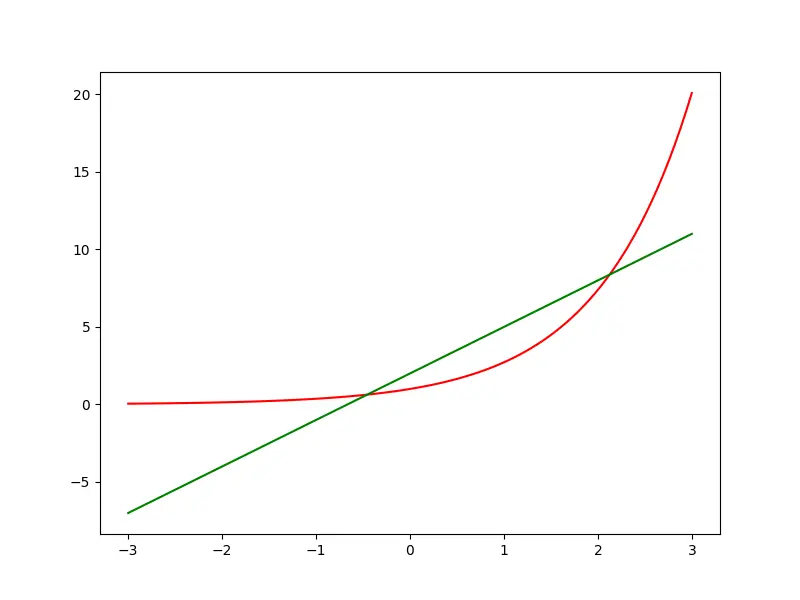
此方法實際上將圖例設定為不可見,但不會刪除圖例。
matplotlib.axes.Axes.plot() 方法中的 label=_nolegend_ 引數
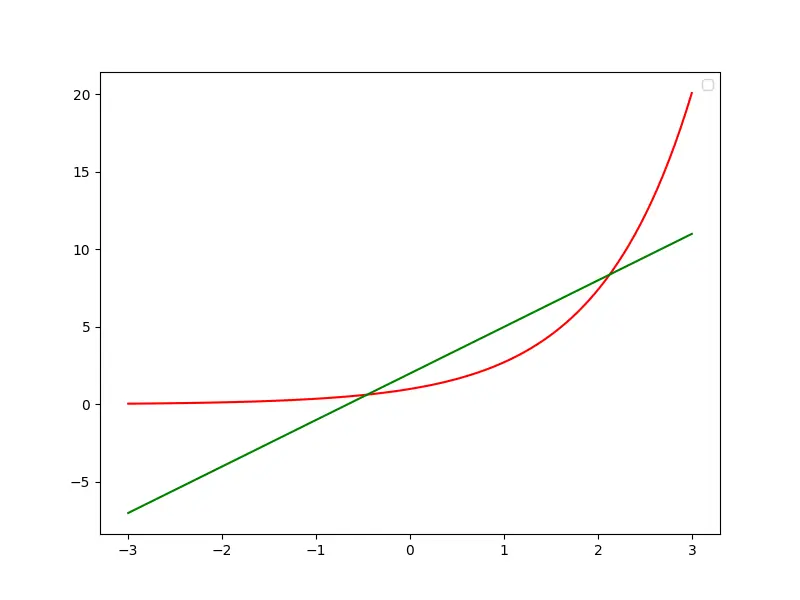
在 matplotlib.axes.Axes.plot()方法中將 label=_nolegend_ 作為引數傳遞也會從 Matplotlib 的圖形中刪除圖例。
import numpy as np
import matplotlib.pyplot as plt

x = np.linspace(-3, 3, 100)
y1 = np.exp(x)
y2 = 3 * x + 2

fig, ax = plt.subplots(figsize=(8, 6))
leg = plt.legend()

ax.plot(x, y1, c="r", label="_nolegend_")
ax.plot(x, y2, c="g", label="_nolegend_")

plt.show()
輸出:
將 axis 物件的 legend_ 屬性設定為 None
將 axis 物件的 legend_ 屬性設定為 None 可以從 Matplotlib 中的圖形中刪除圖例。
import numpy as np
import matplotlib.pyplot as plt

x = np.linspace(-3, 3, 100)
y1 = np.exp(x)
y2 = 3 * x + 2

fig, ax = plt.subplots(figsize=(8, 6))
leg = plt.legend()

ax.plot(x, y1, c="r", label="expoential")
ax.plot(x, y2, c="g", label="Straight line")

plt.gca.legend_ = None

plt.show()
輸出: